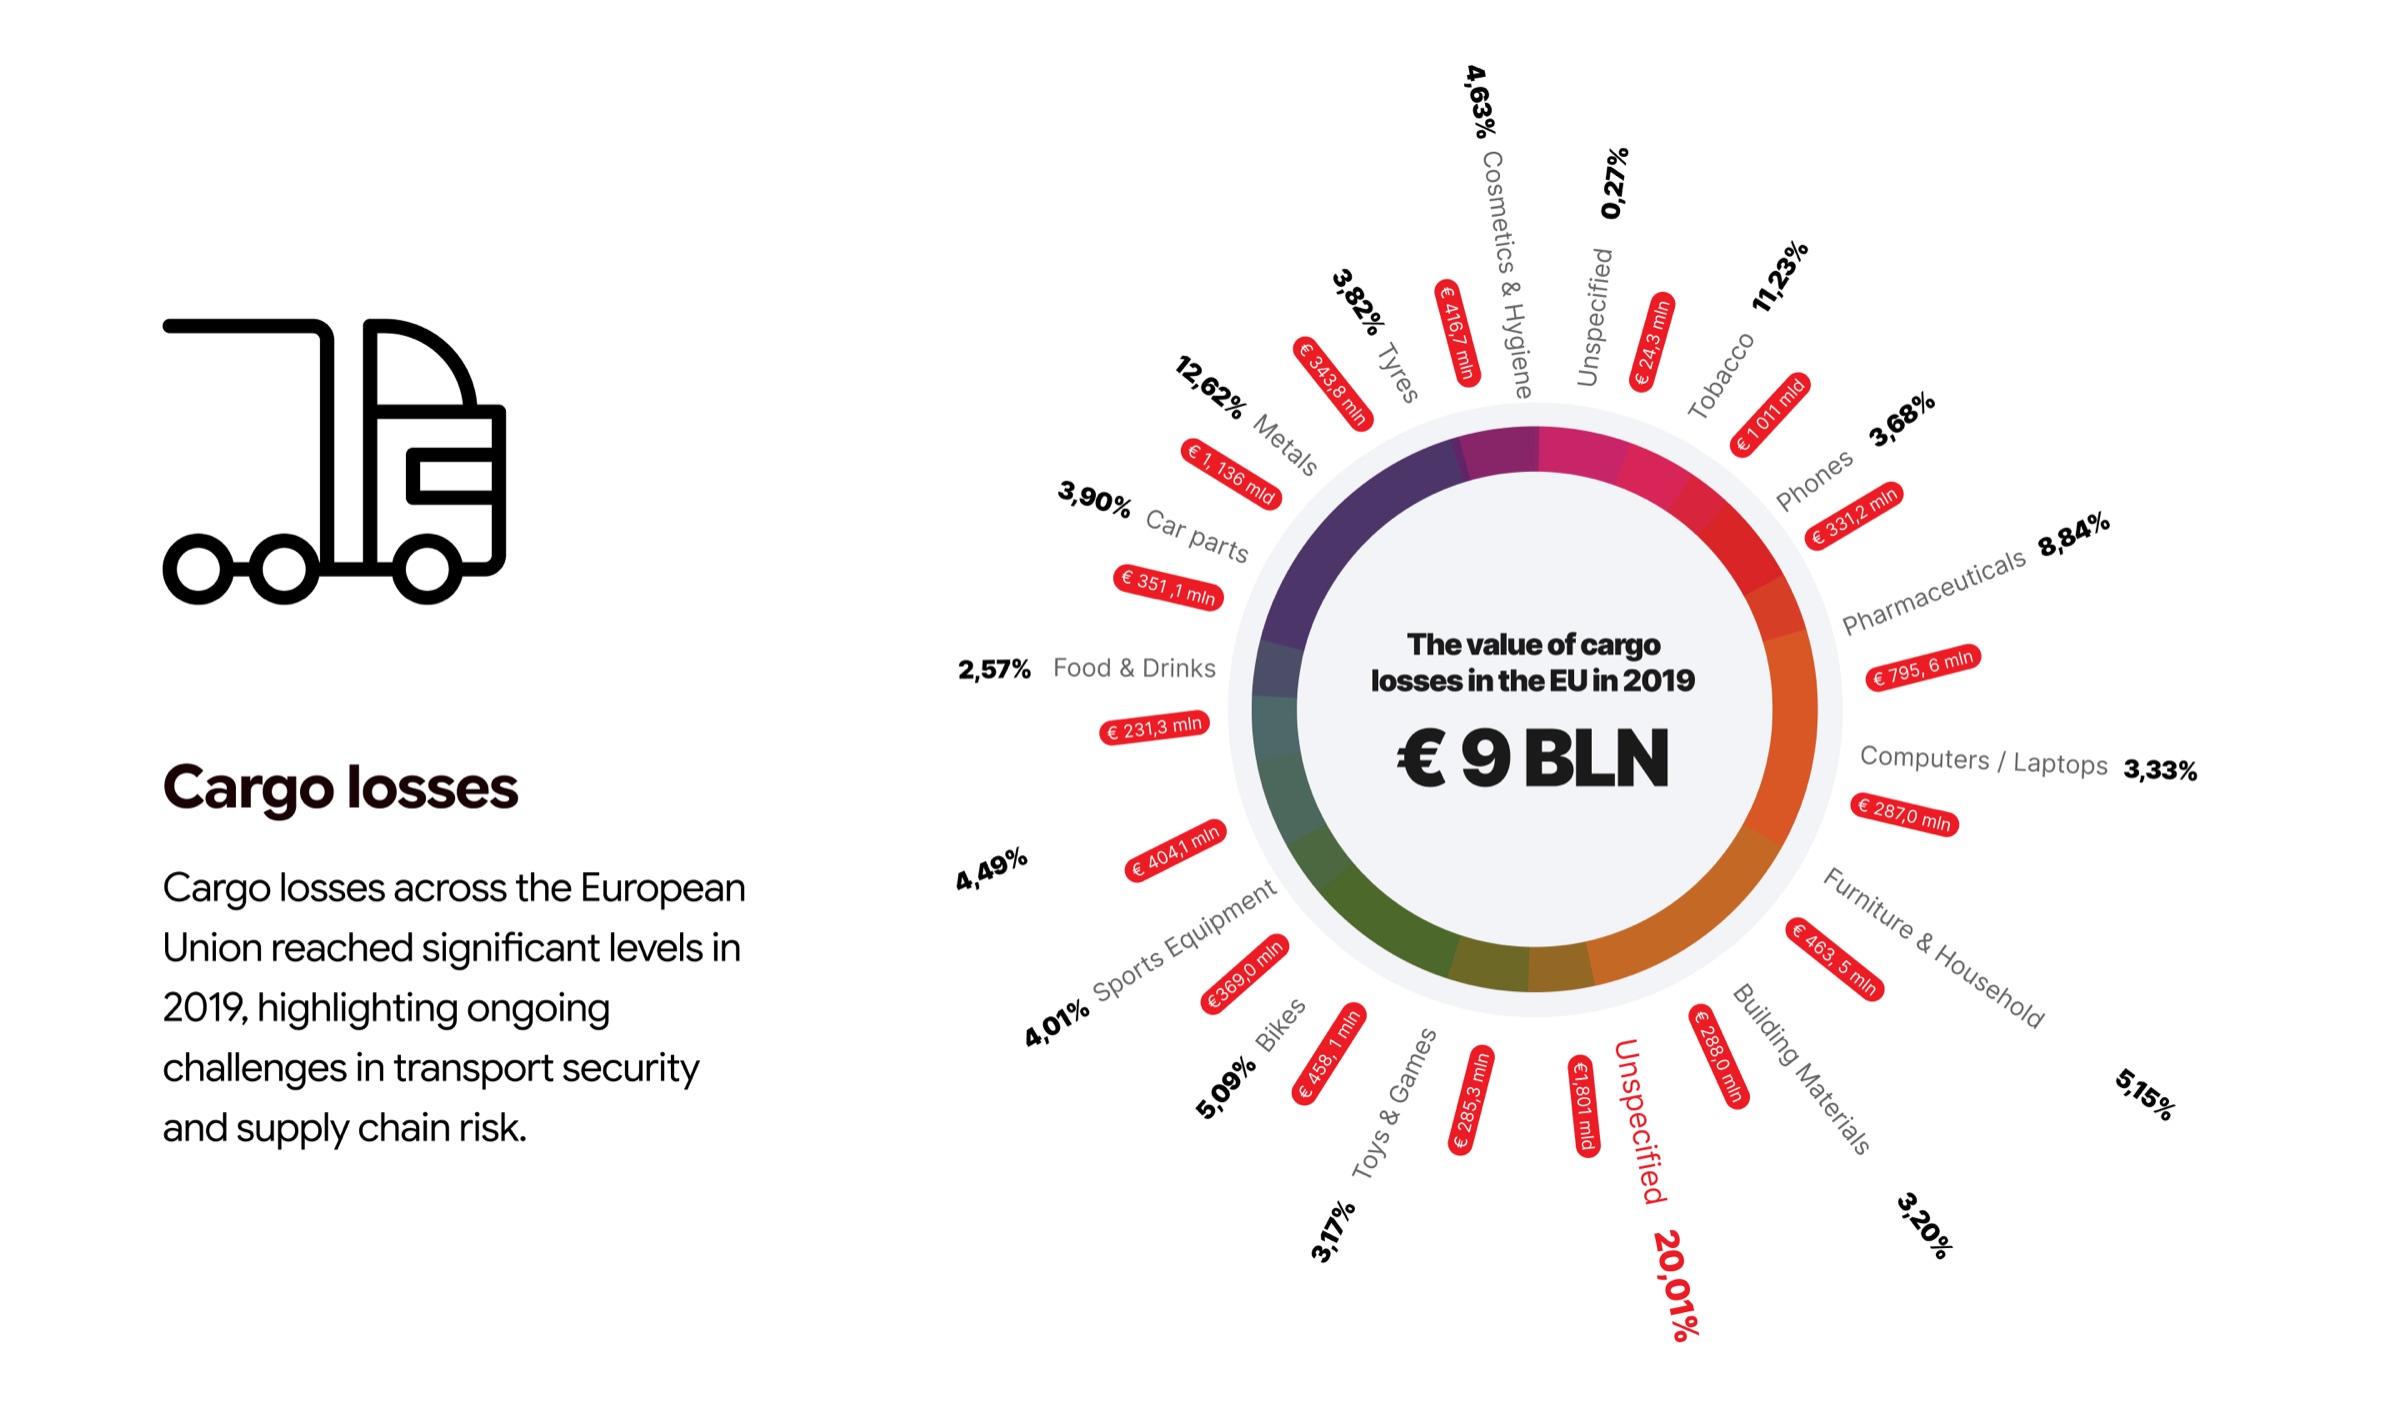
Every year, €9 billion worth of cargo disappears from European roads. Not in dramatic heists — in quiet, preventable moments no one was watching. Our ambition was to design a platform that changes what 'watching' means.
Picture a control room. Sixteen monitors. Twenty camera feeds. A single operator whose job is to watch all of them at once and somehow catch the one frame where something goes wrong. This was the state of fleet security across Europe — an industry spending millions on cameras while cargo kept disappearing.
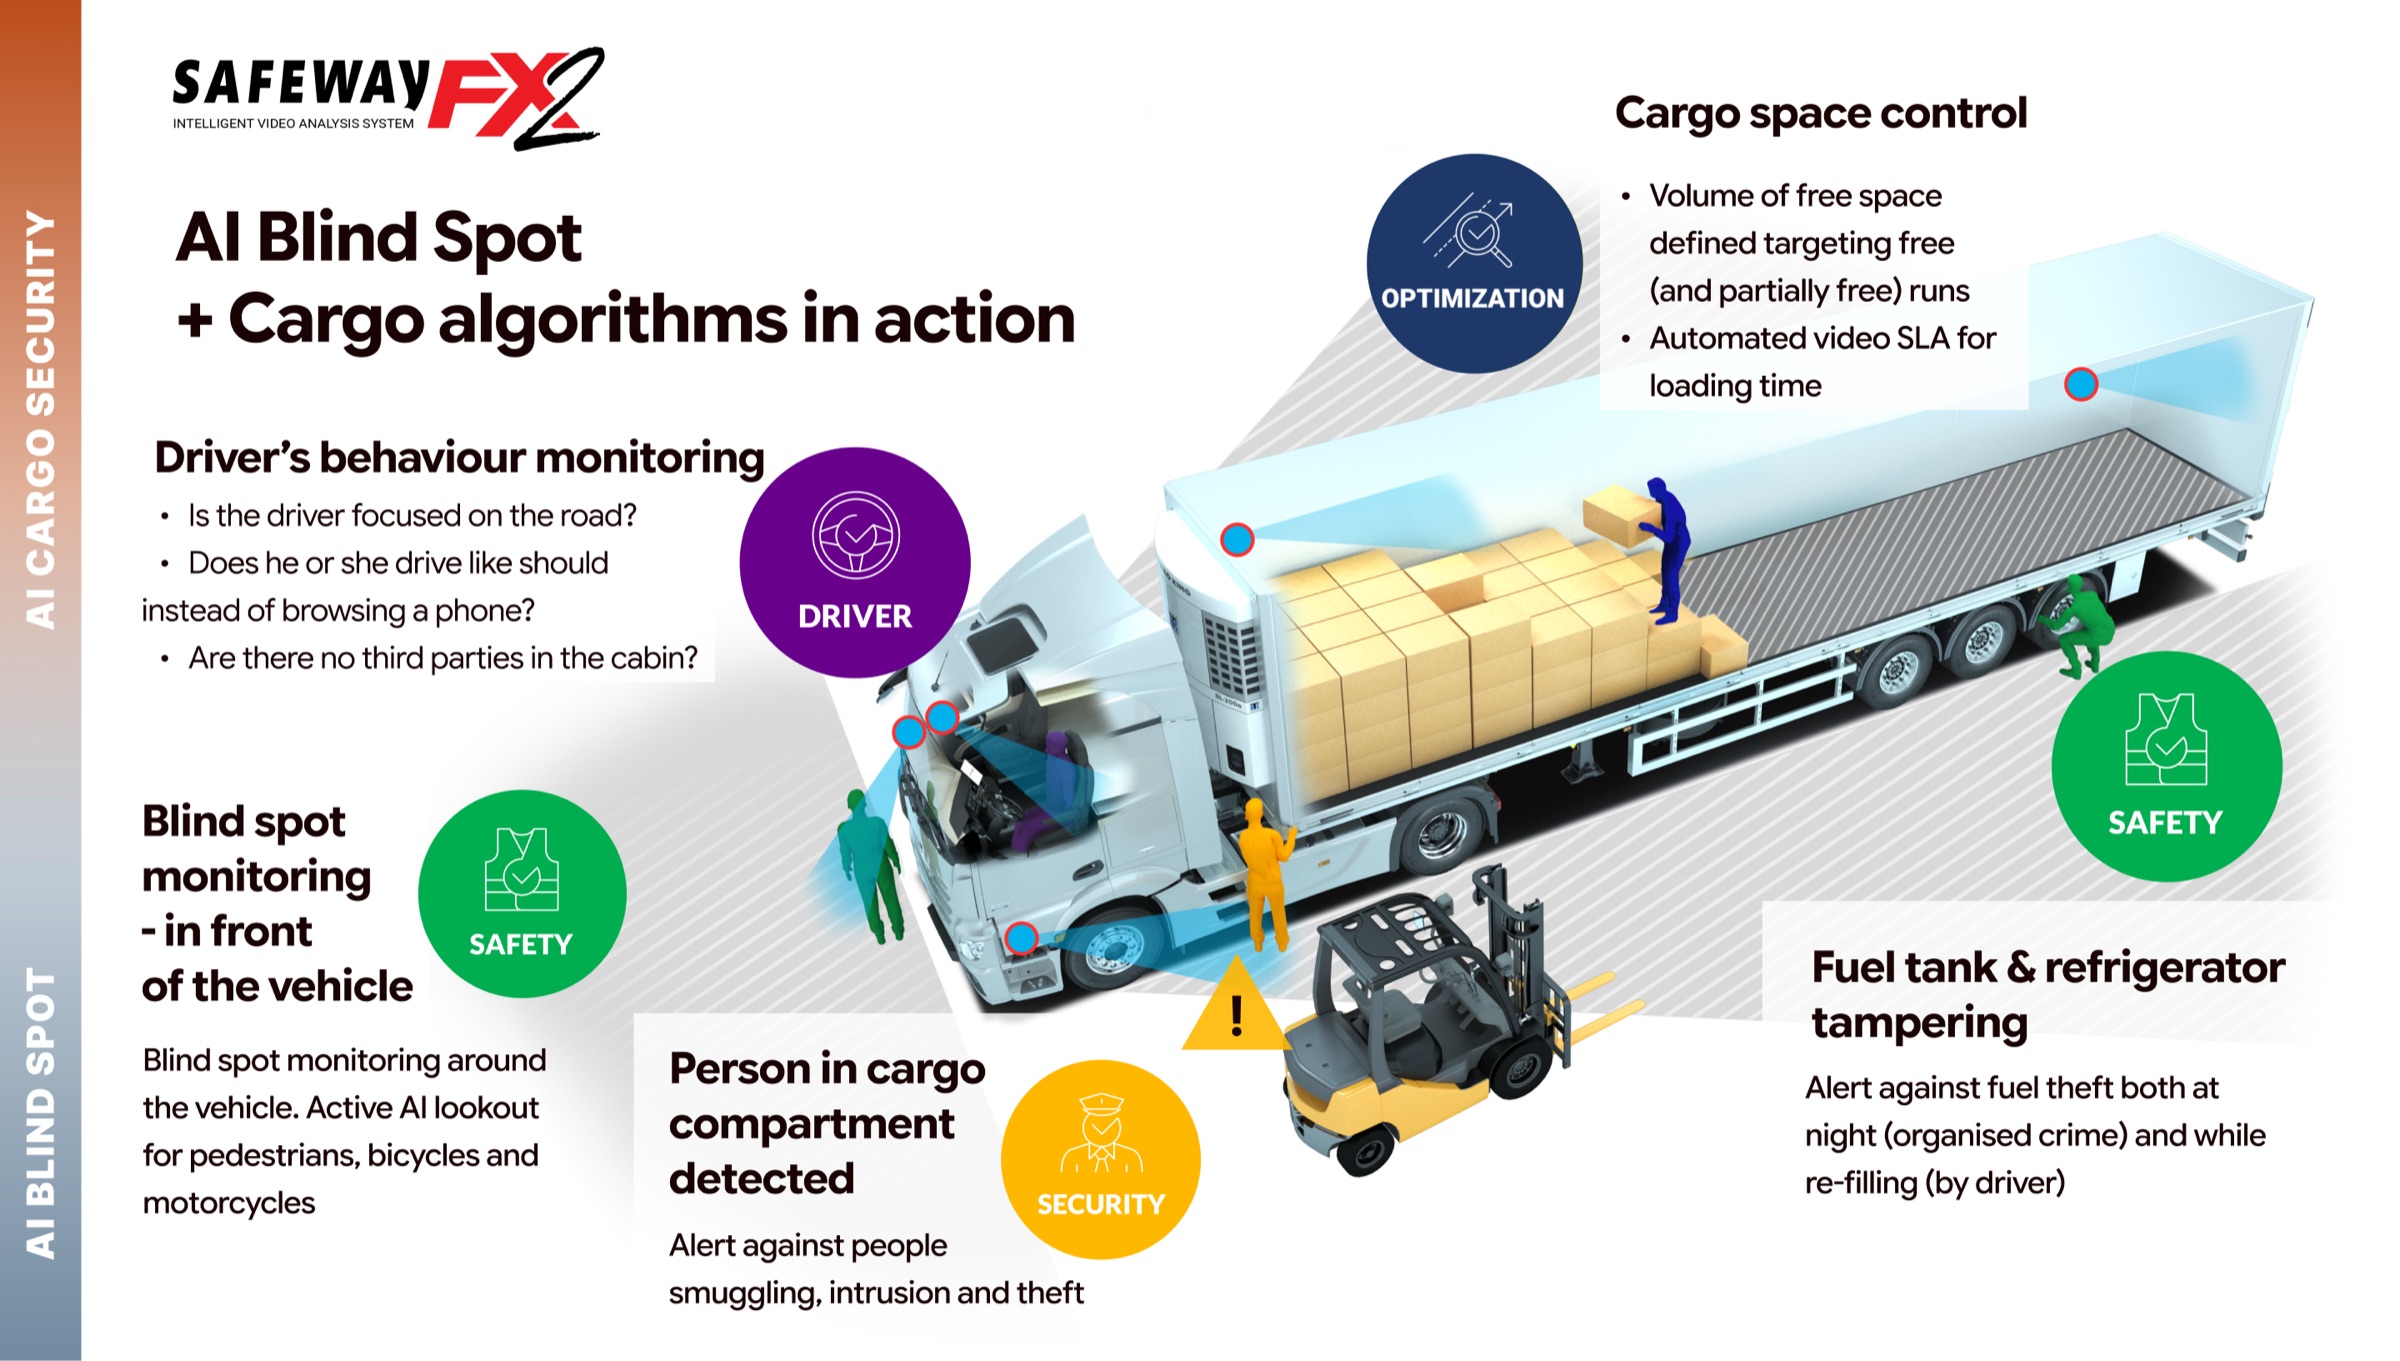
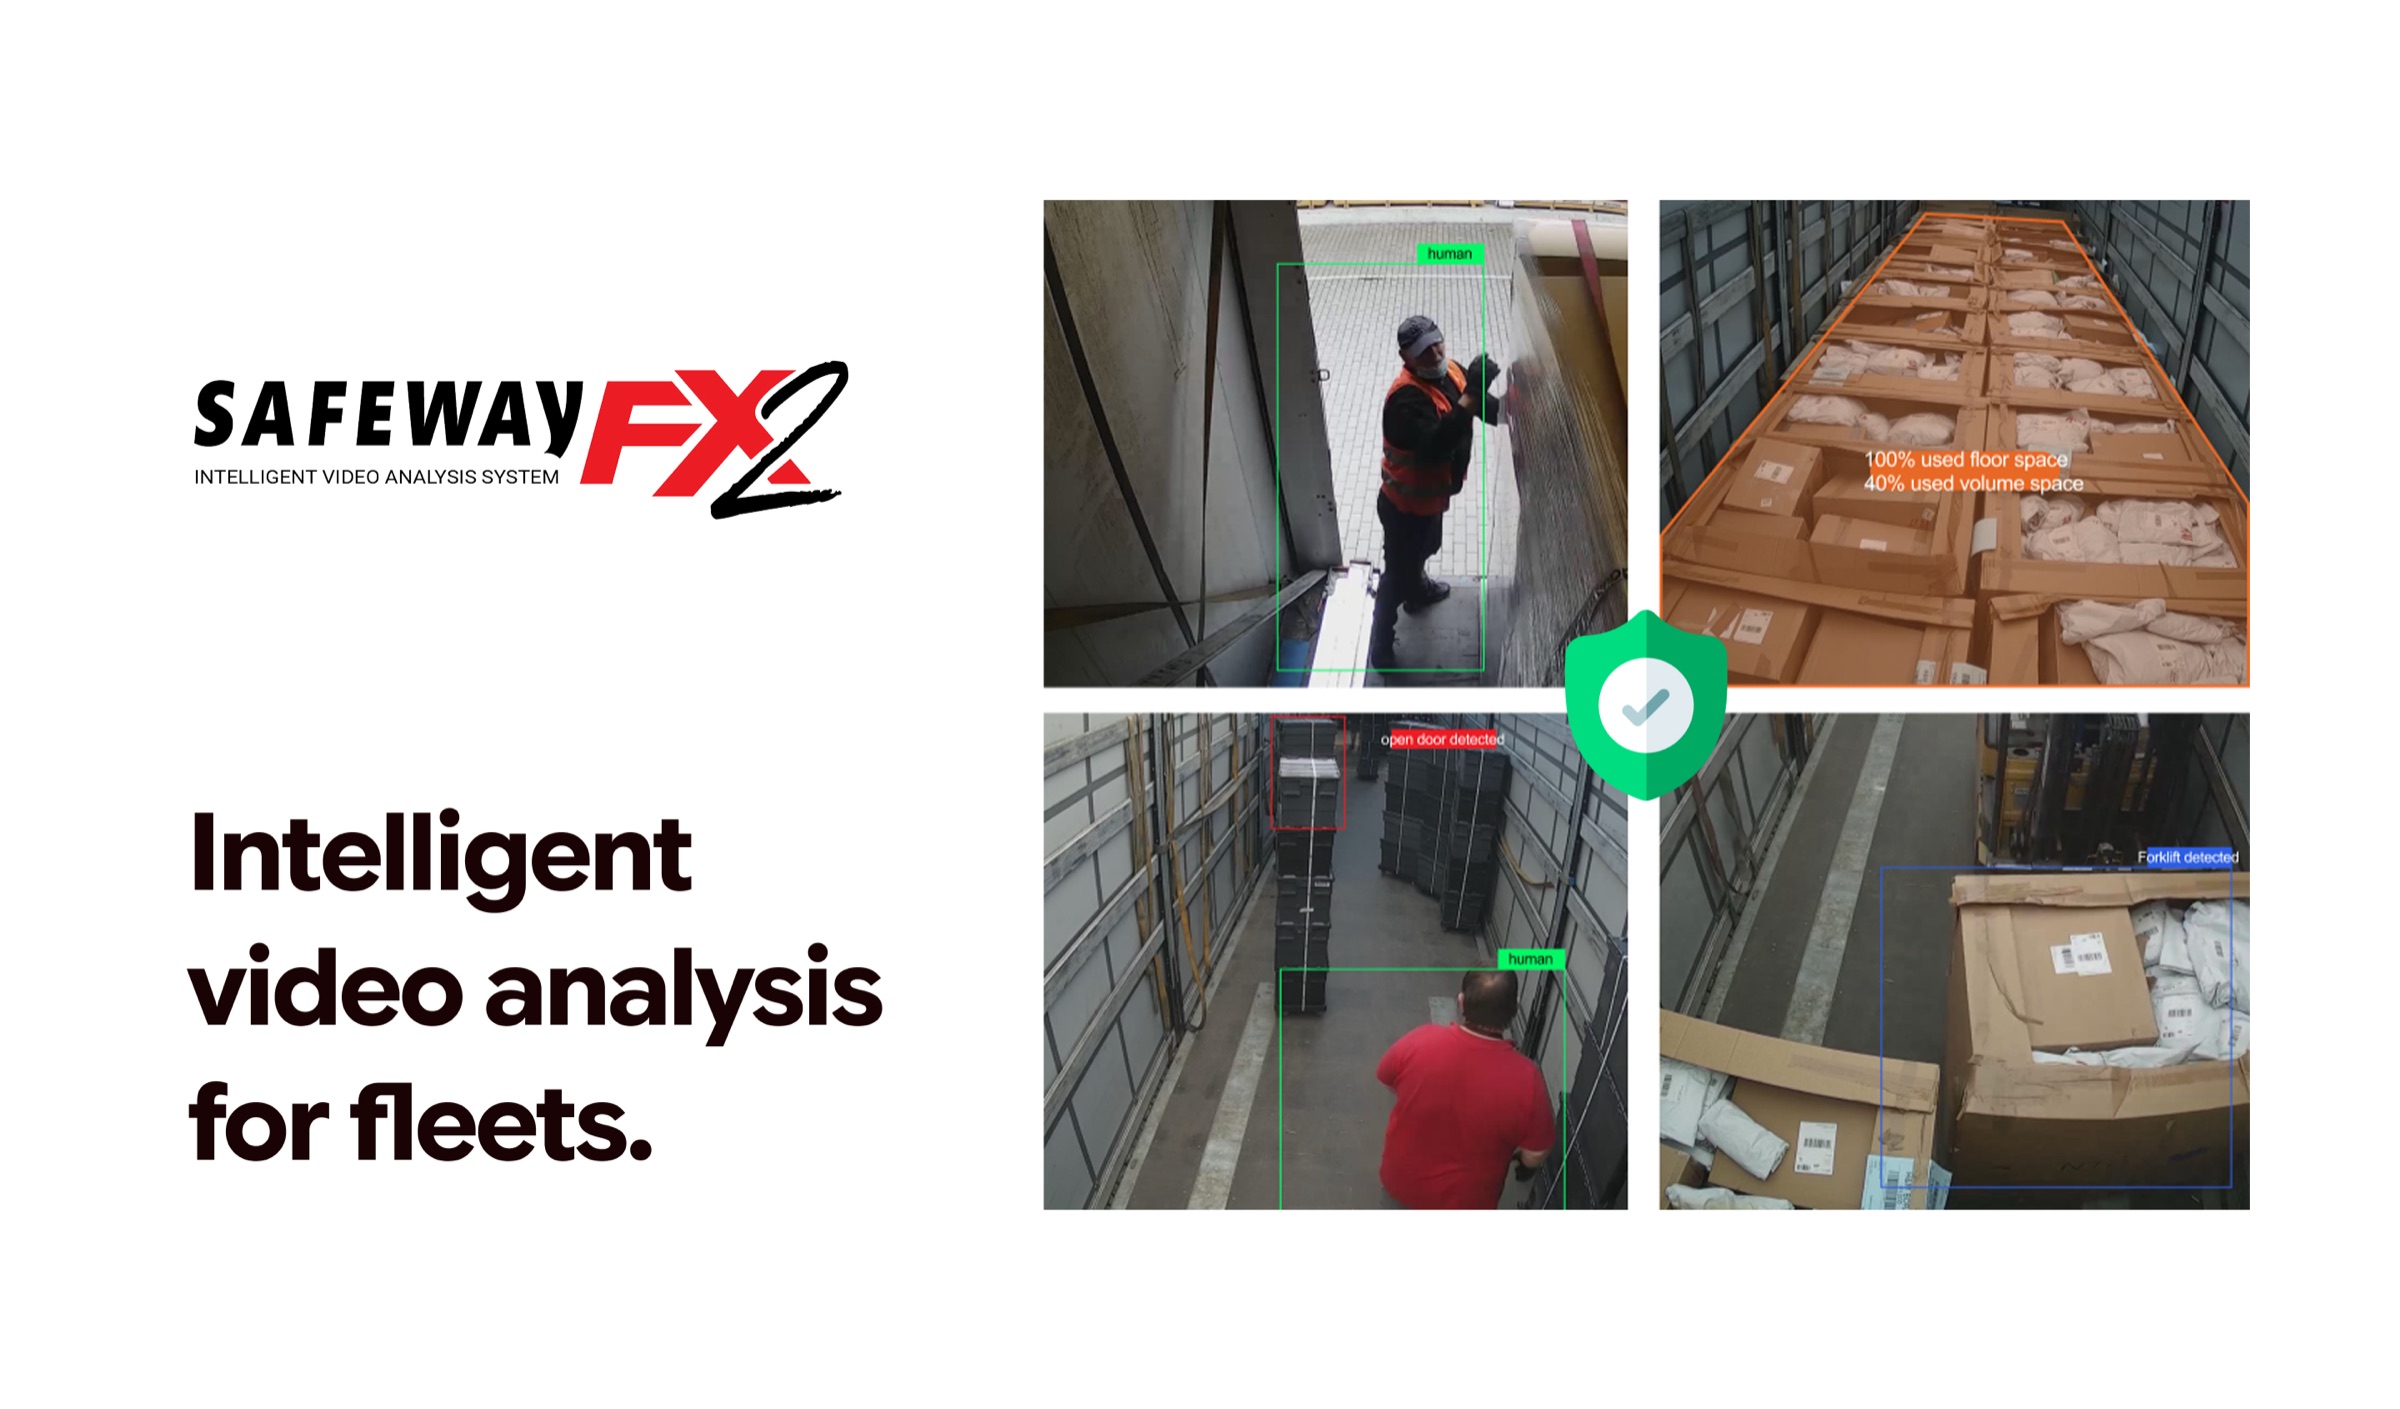
Sternkraft had built the AI. Their SafeWay FX2 hardware could detect intrusions, monitor driver behavior, and analyze cargo space in real time. But the software wrapping it was an engineer's dashboard: dense, unintuitive, and designed around system logic rather than human cognition. Operators needed weeks of training. Most alerts were missed. The technology worked — the experience didn't.
Before touching a single pixel, I embedded myself in the world of fleet operators. I interviewed dispatchers at two cargo companies — one mid-size (45 trucks, Netherlands) and one enterprise (200+ vehicles, cross-border routes through Germany, France, and Italy). I learned how they worked, what they ignored, and where they got stuck.
I conducted contextual interviews with dispatchers and fleet managers in the Netherlands, Germany, and Poland. Each session lasted 90 minutes — half observation, half structured interview about their daily workflows, pain points, and workarounds.
I audited several fleet monitoring tools on the market. The pattern was consistent: camera-centric architectures, flat alert lists with no prioritization, and navigation structures that mirrored database schemas rather than operator mental models.
Working with Sternkraft's data team, I analyzed six months of alert data across 180 vehicles. 73% of all alerts were dismissed without action. Of the incidents that did get reviewed, the average response time was 47 minutes — far too late for real-time intervention.
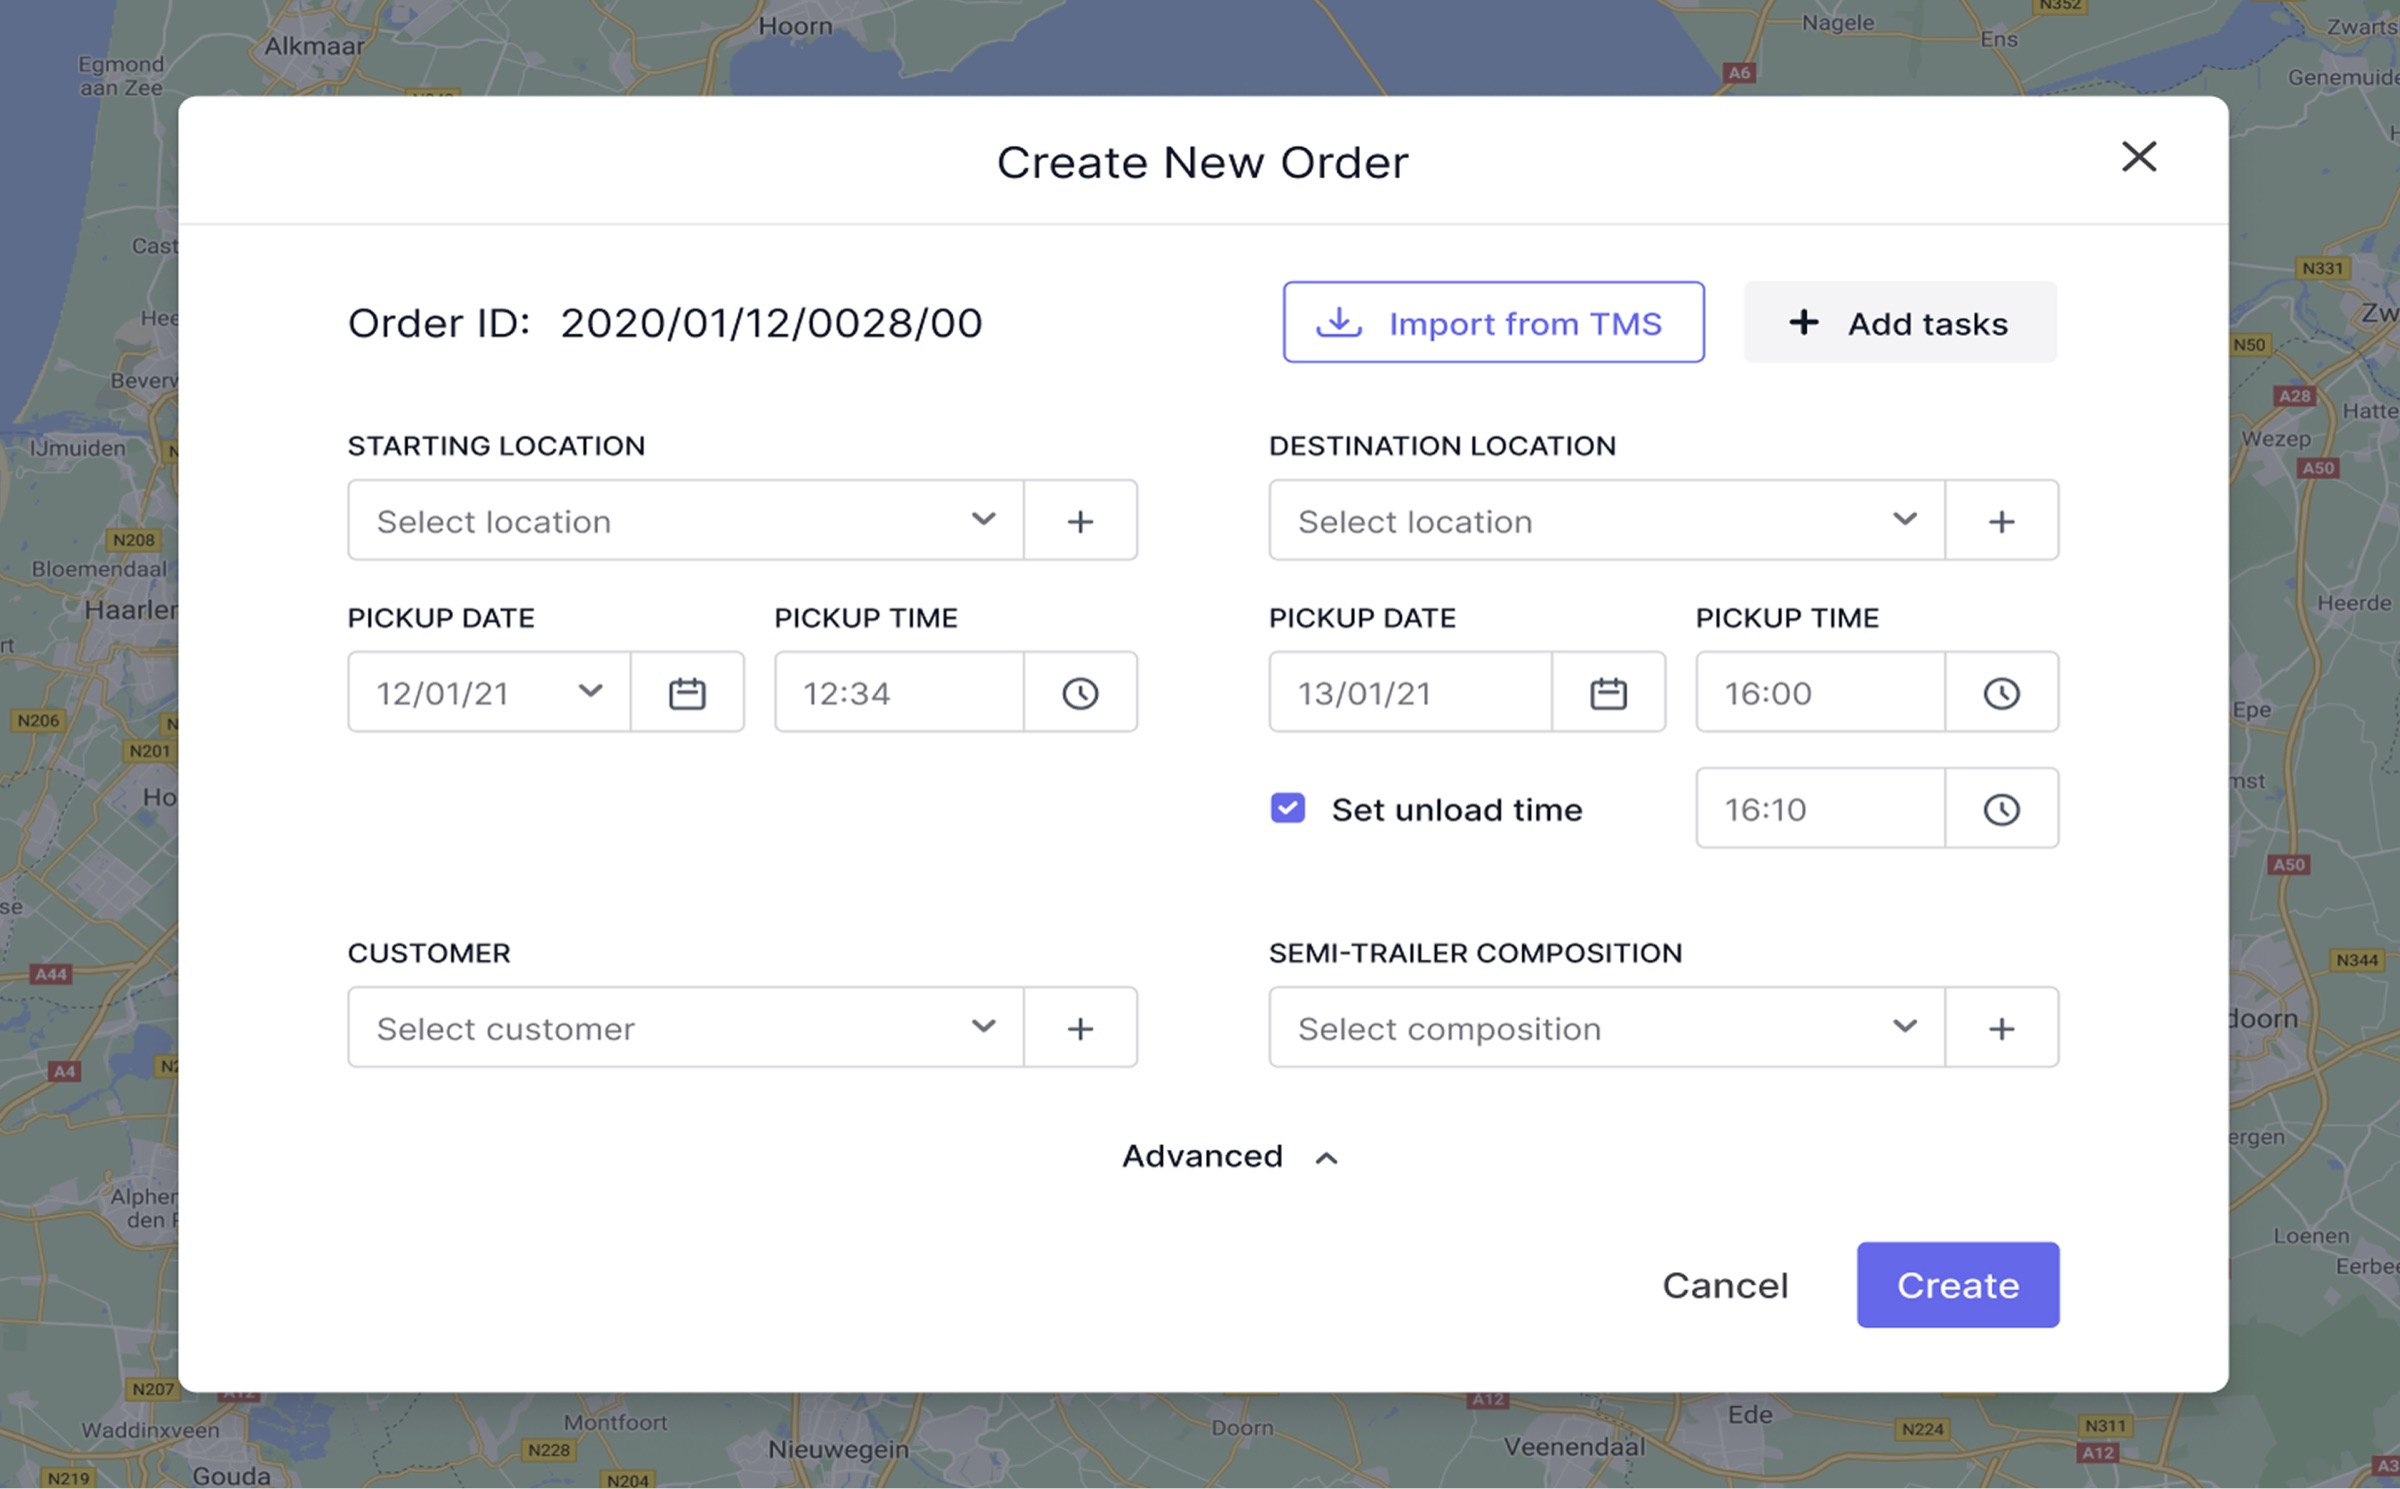
I mapped the end-to-end workflows for the four most common tasks: responding to a live alert, reviewing historical footage, checking order status, and evaluating driver performance. Each journey revealed redundant steps and unnecessary context switches.
"Operators weren't failing because they were careless. They were failing because the tool demanded superhuman attention. The system watched 20 feeds — the human could watch maybe three. We were designing for the wrong species."
The research crystallized into one core insight: the platform shouldn't help operators watch cameras better — it should eliminate the need to watch cameras at all. The AI was already doing the watching. The operator's real job was to make decisions when something happened. Every design choice that followed was in service of that shift.
I distilled the research into three design principles that would govern every decision from information architecture to micro-interactions.
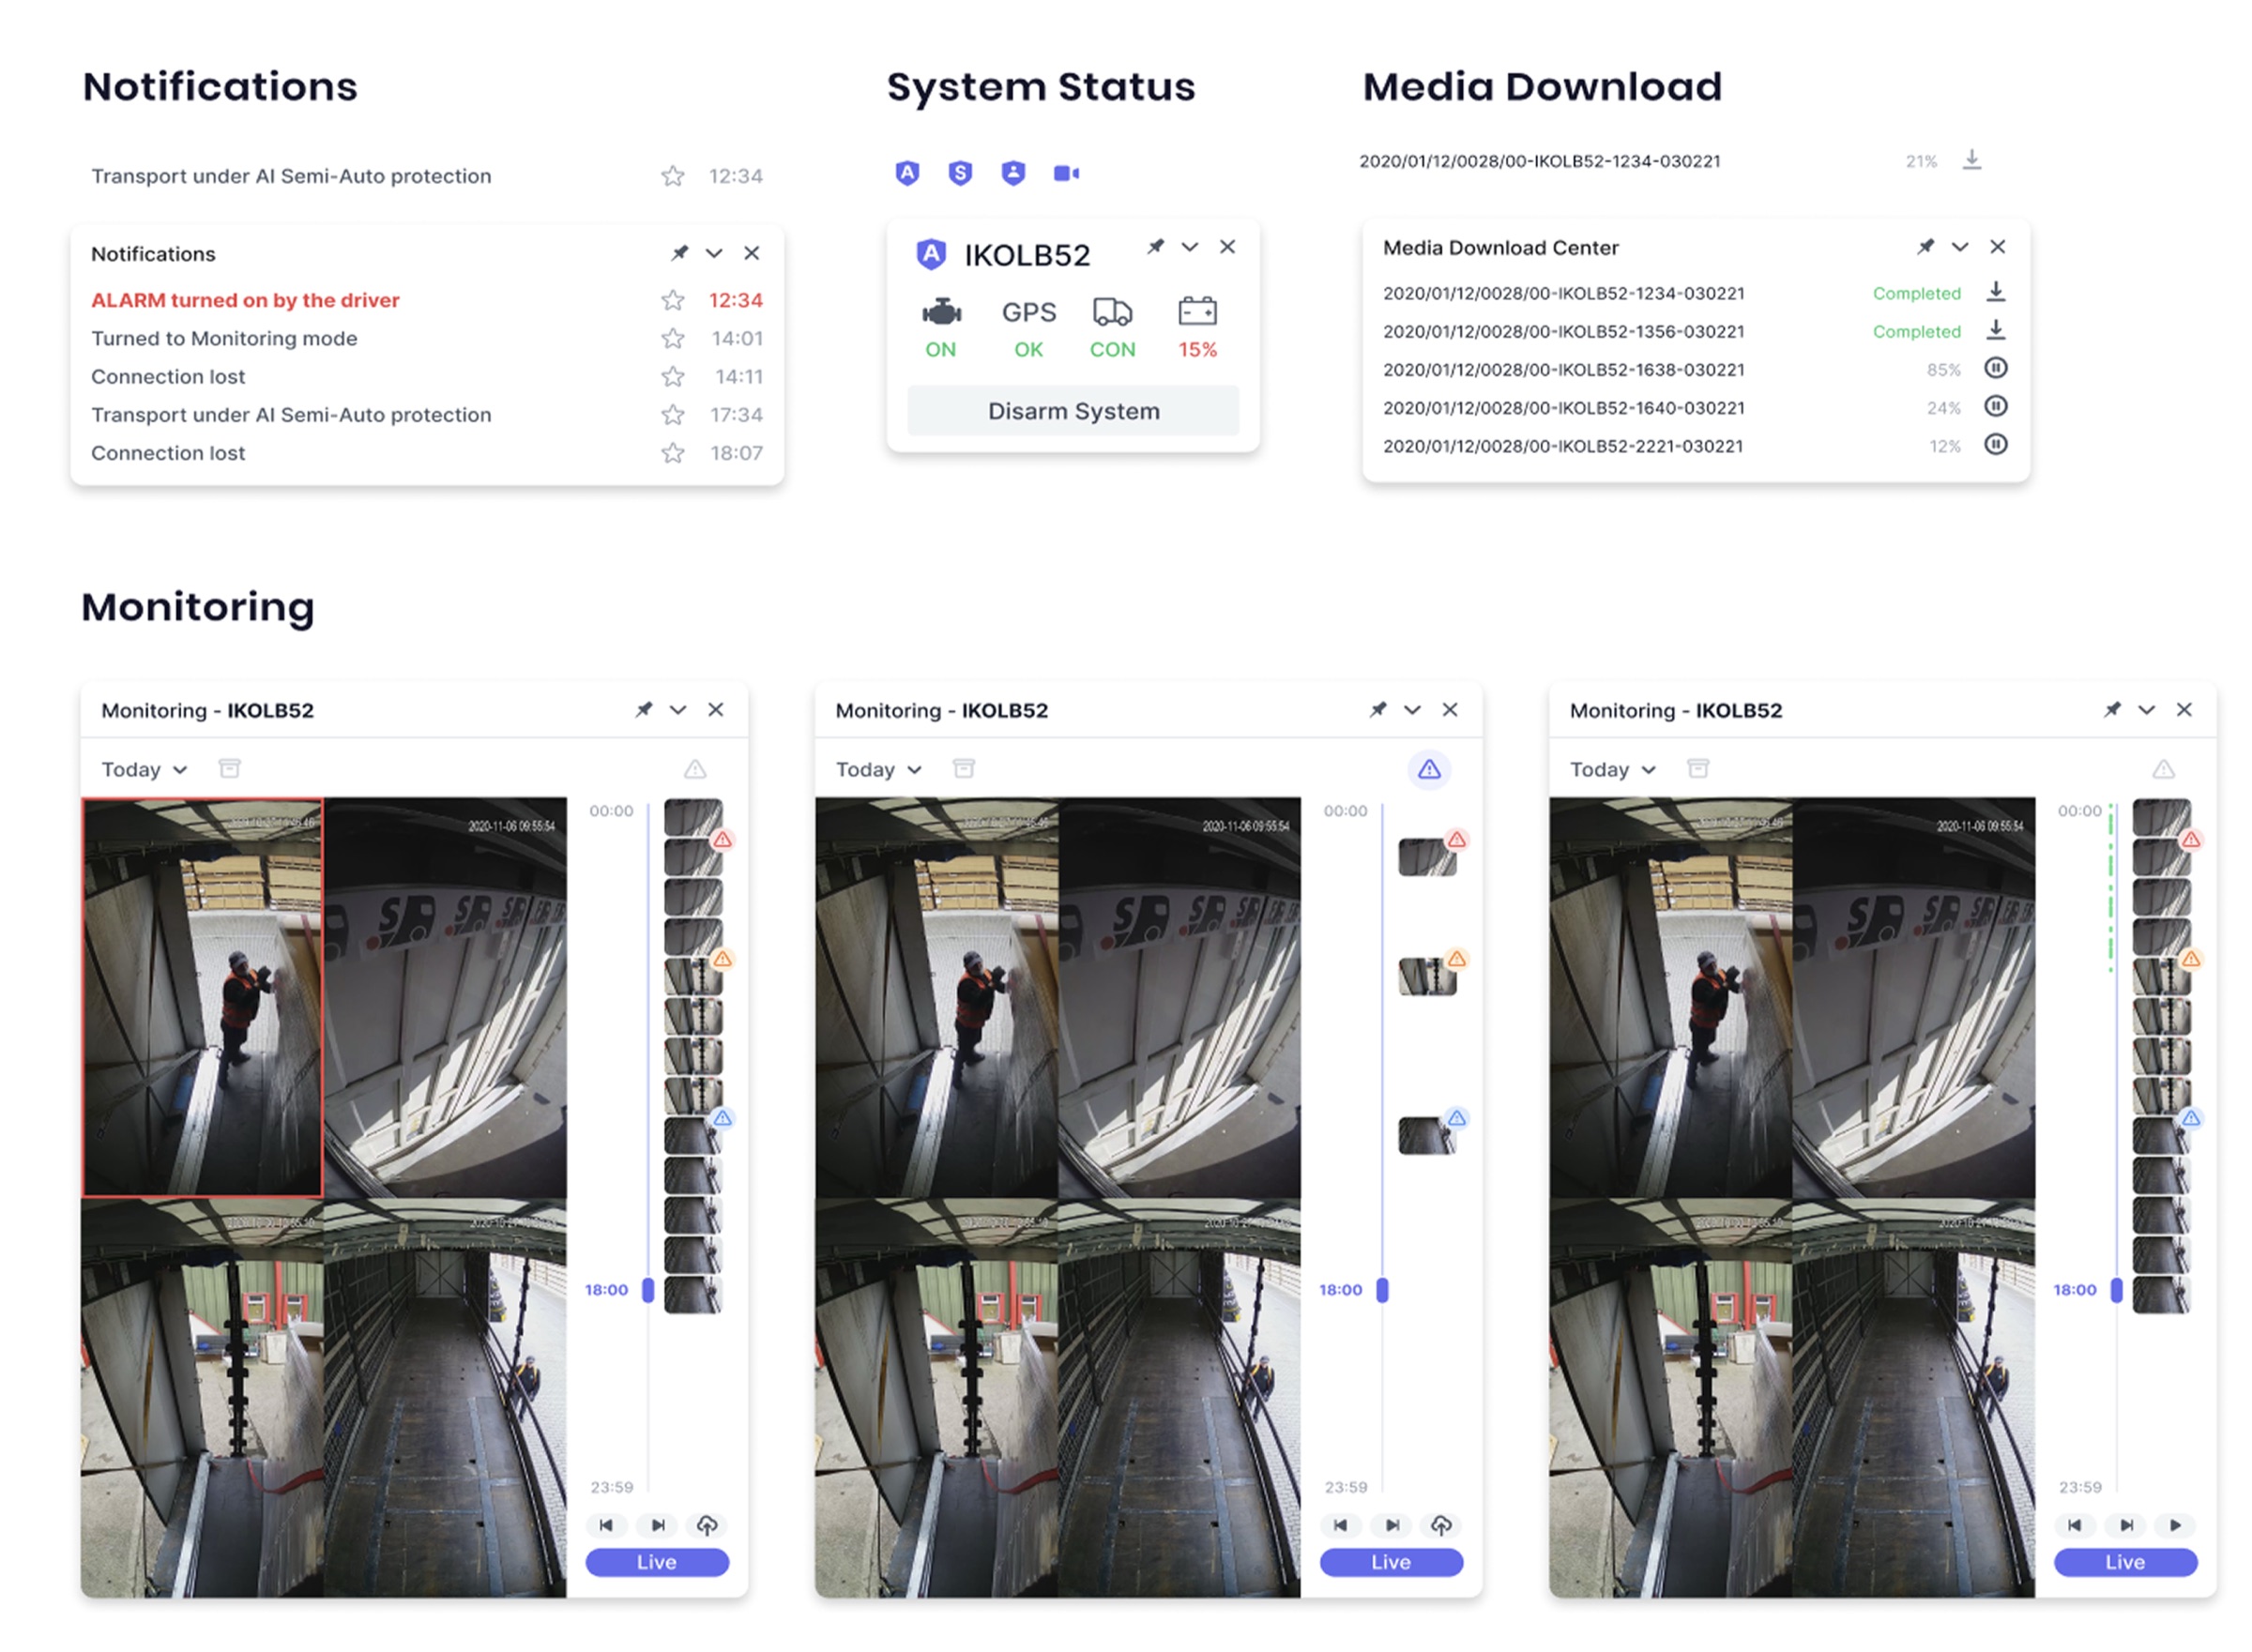
Stop showing operators 20 camera feeds and expecting them to spot problems. Instead, let the AI watch the feeds and surface events when something happens. The operator's job shifts from "stare at screens" to "respond to what matters."
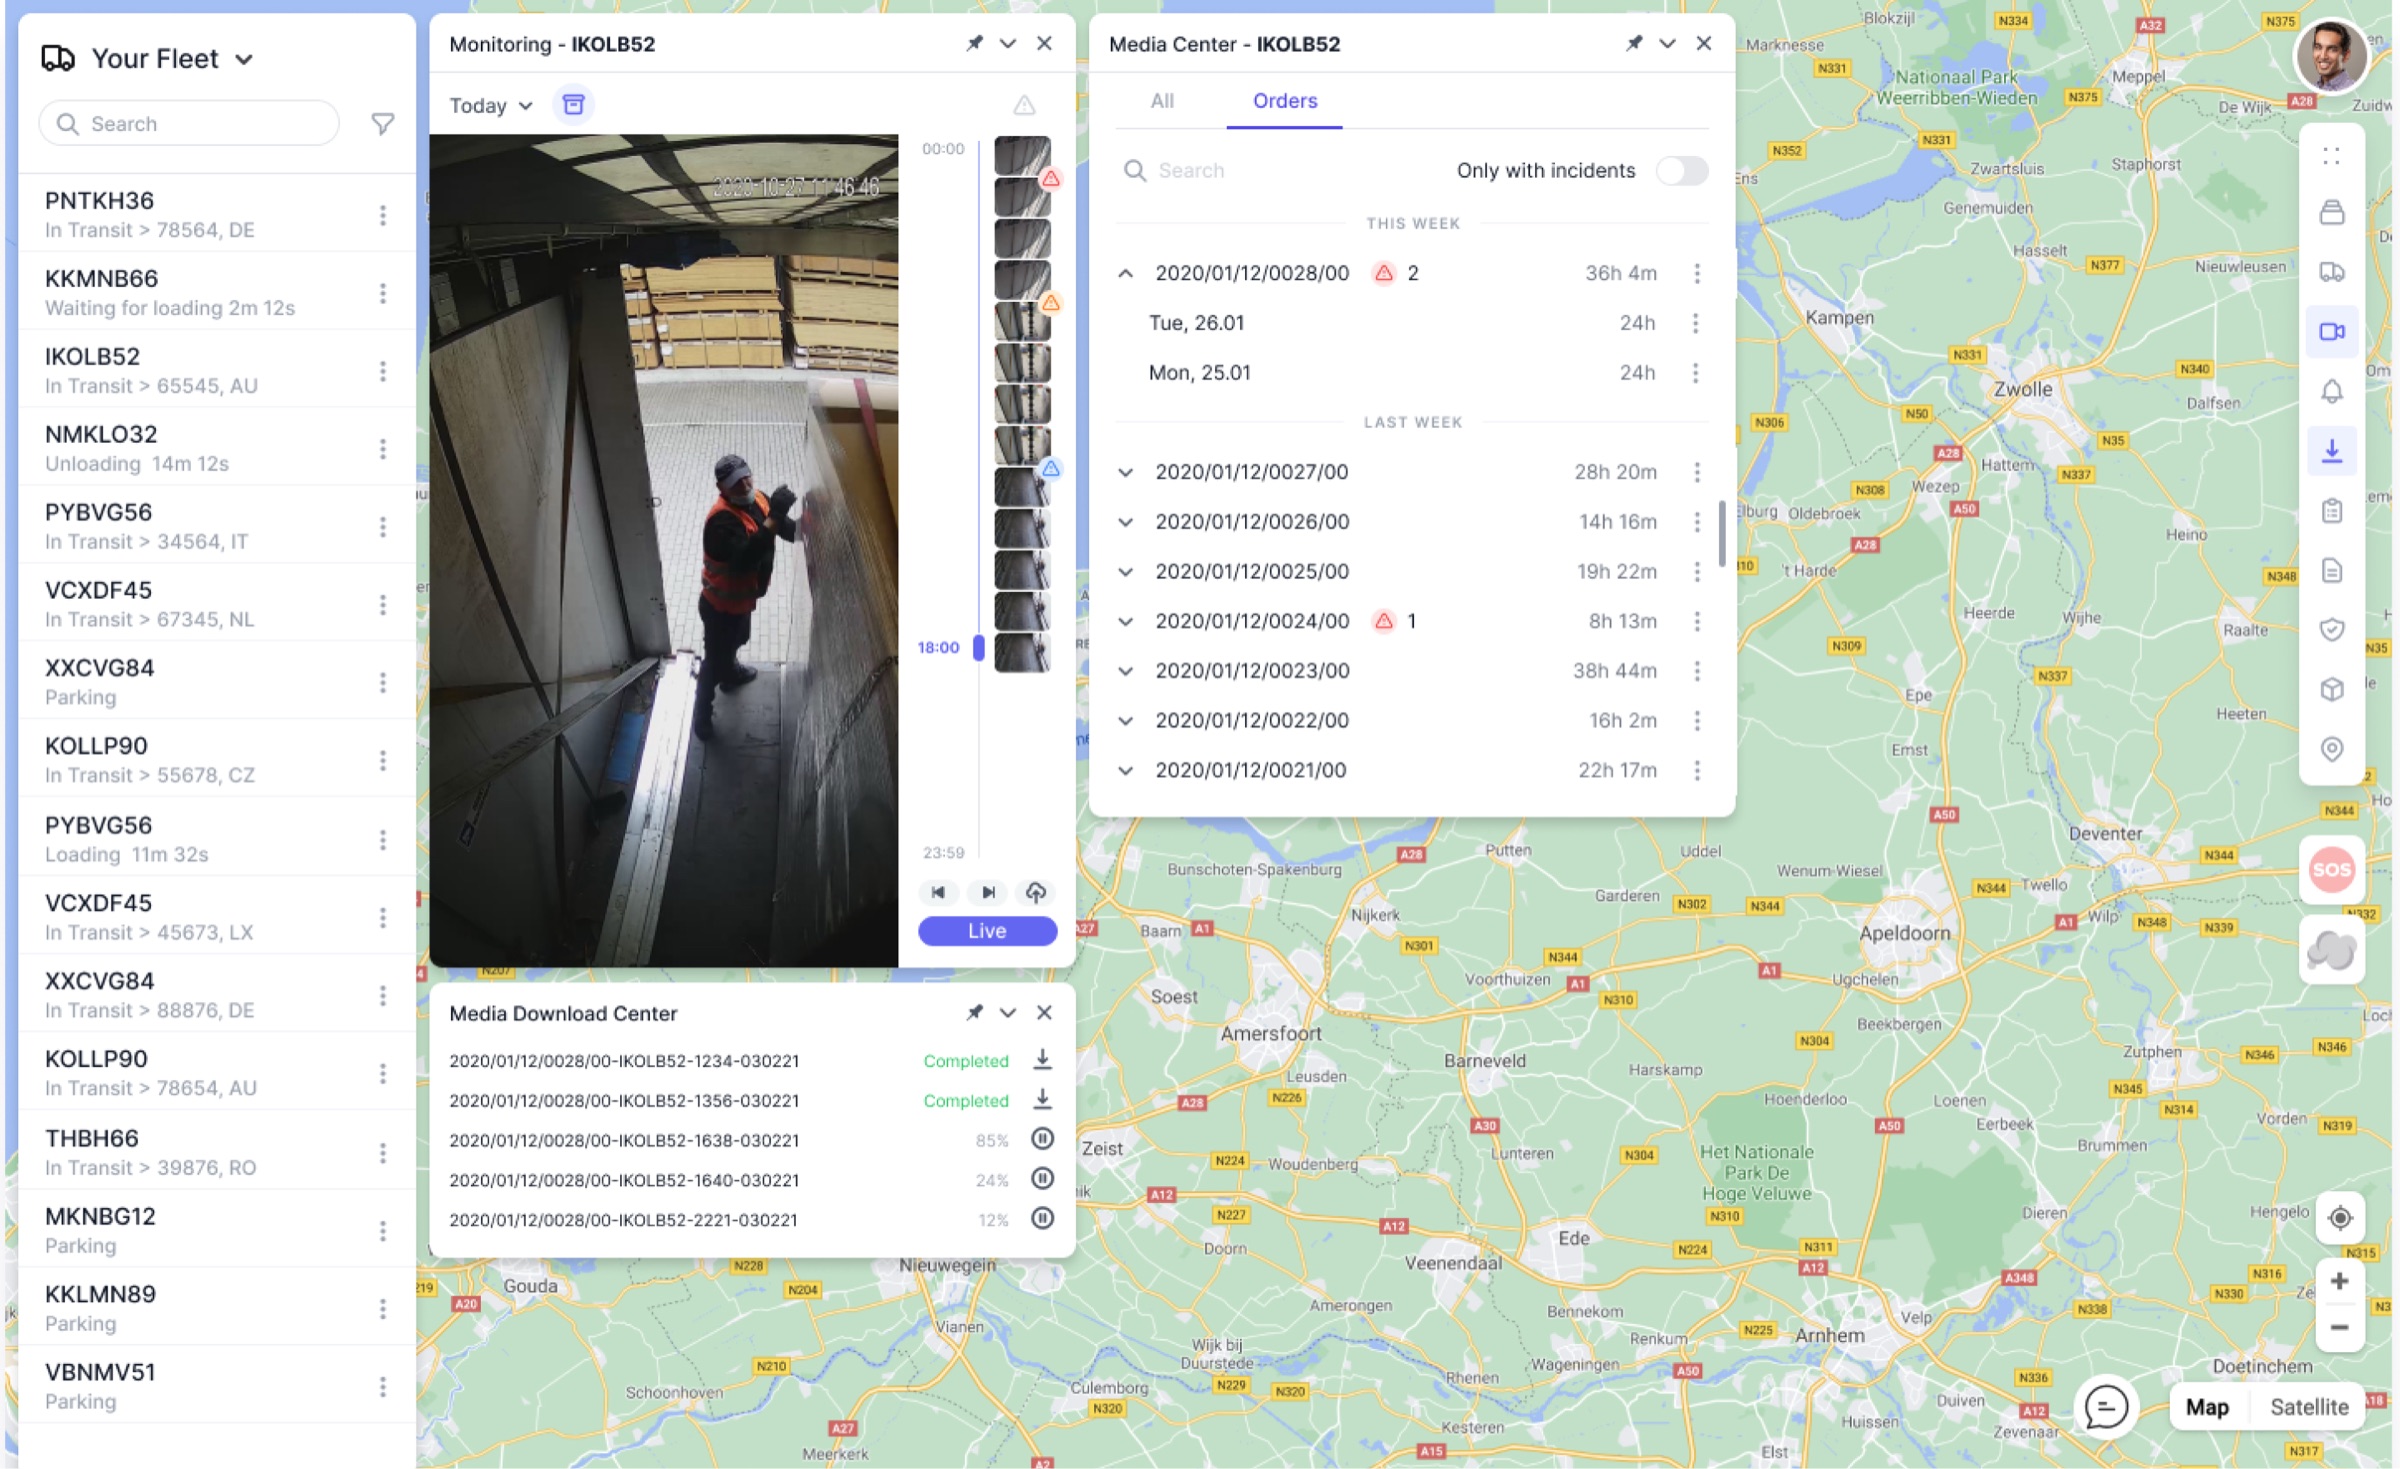
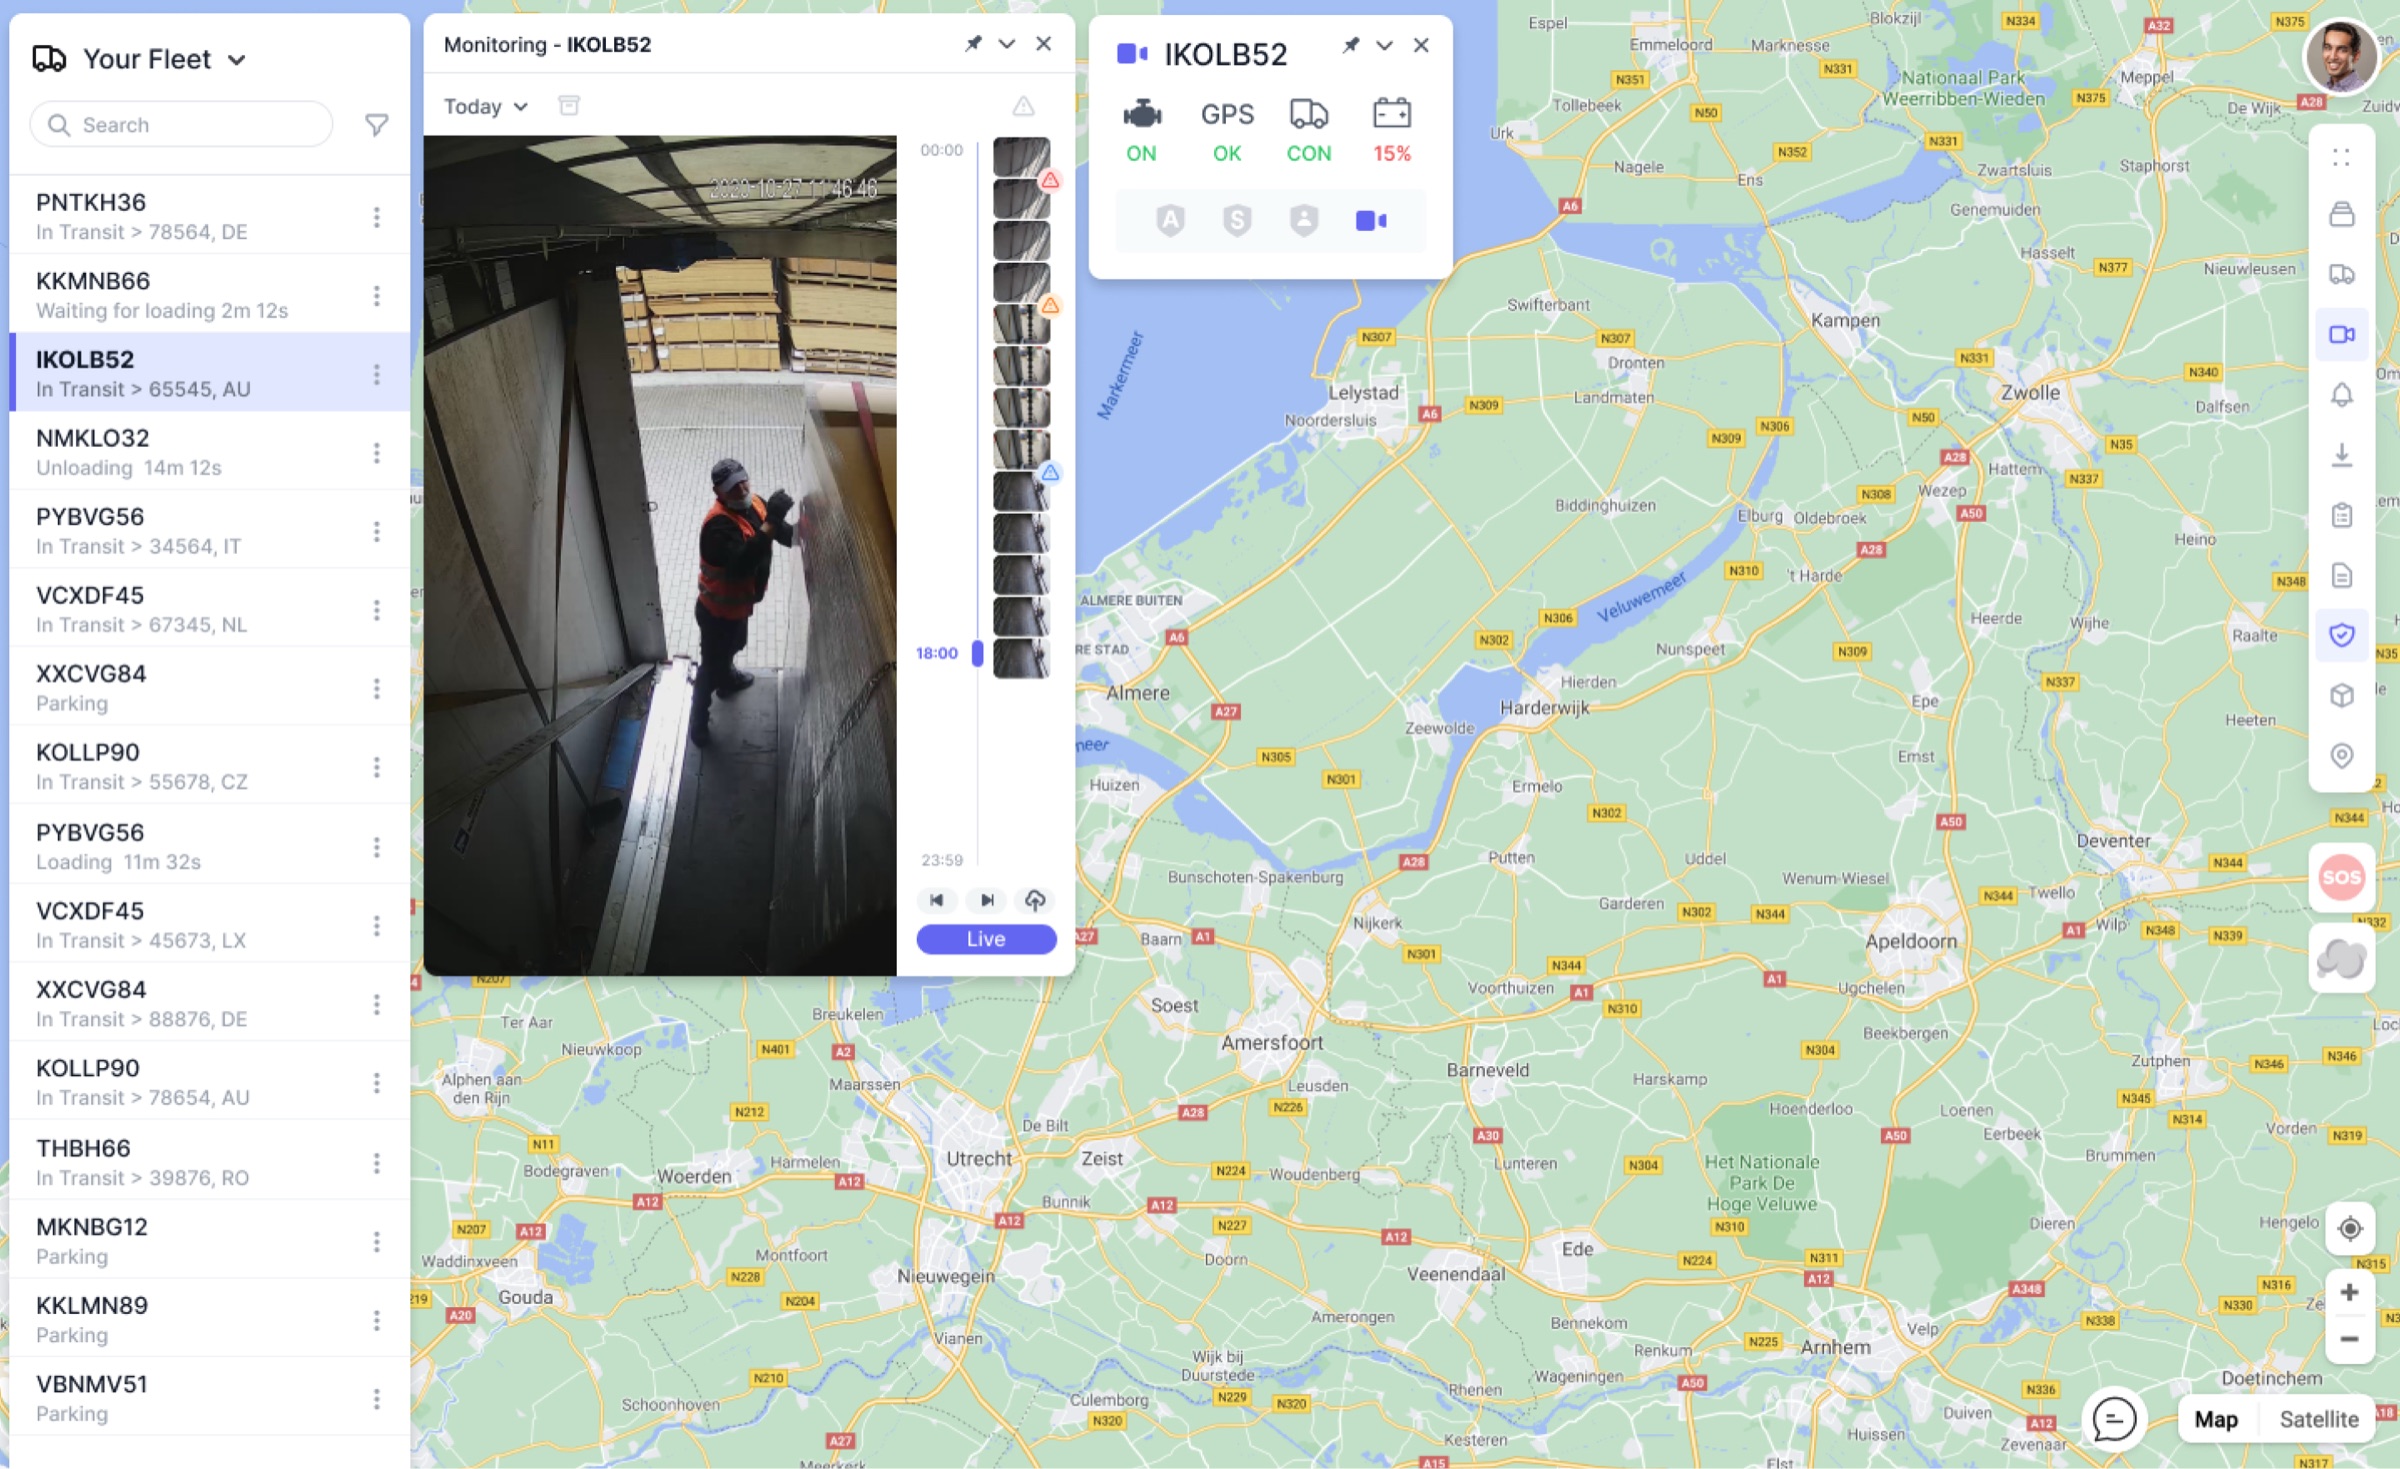
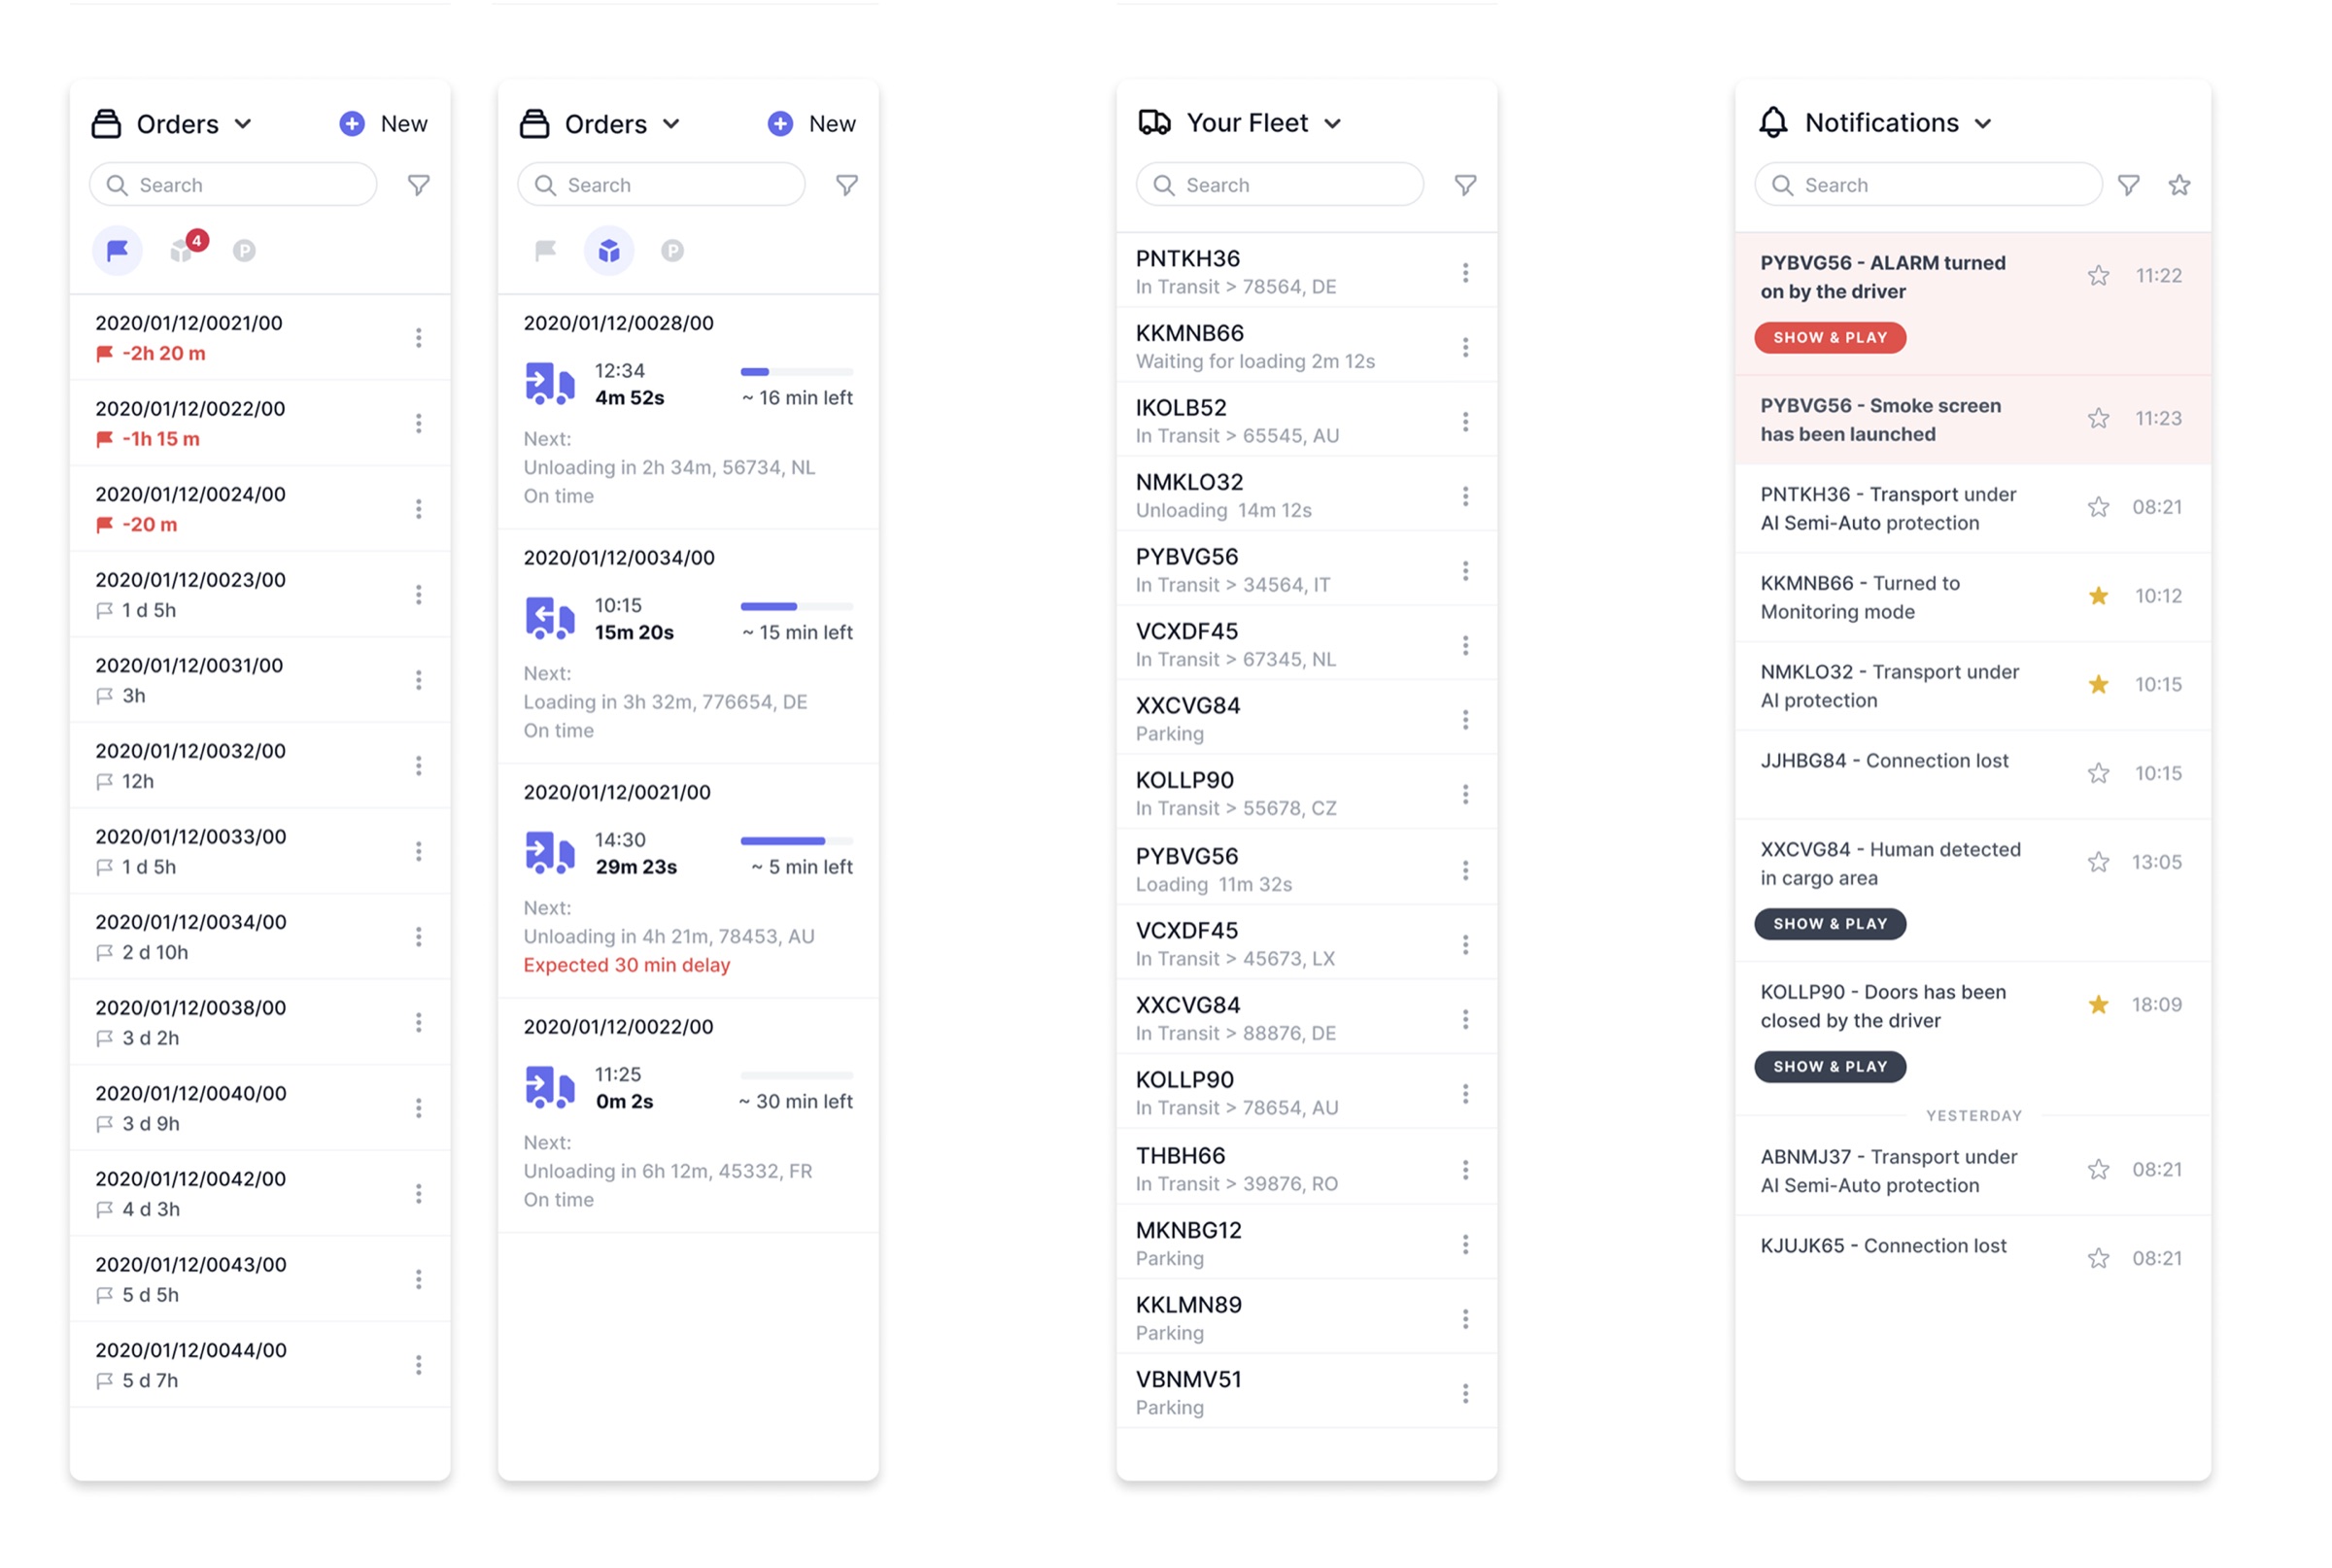
Every interaction starts from a vehicle. Fleet managers don't navigate to "the monitoring section" or "the alerts page" — they ask "what's going on with truck 47?" The entire information architecture had to mirror that mental model.
Operators were constantly bouncing between "where is this truck," "what does the camera show," and "what's the order status." The workspace needed to let operators hold multiple threads simultaneously — seeing the live feed, the map position, and the alert history all at once.
The solution is a map-centric, panel-based workspace where AI does the surveillance and humans do the decision-making. Rather than dedicated pages for each function, the interface uses floating panels that can be opened, pinned, stacked, and rearranged around a central map.
This wasn't a product where I could rely on convention. Fleet monitoring has no established UX patterns worth following — only legacy interfaces built by engineers for engineers. Every interaction pattern had to be designed from first principles.
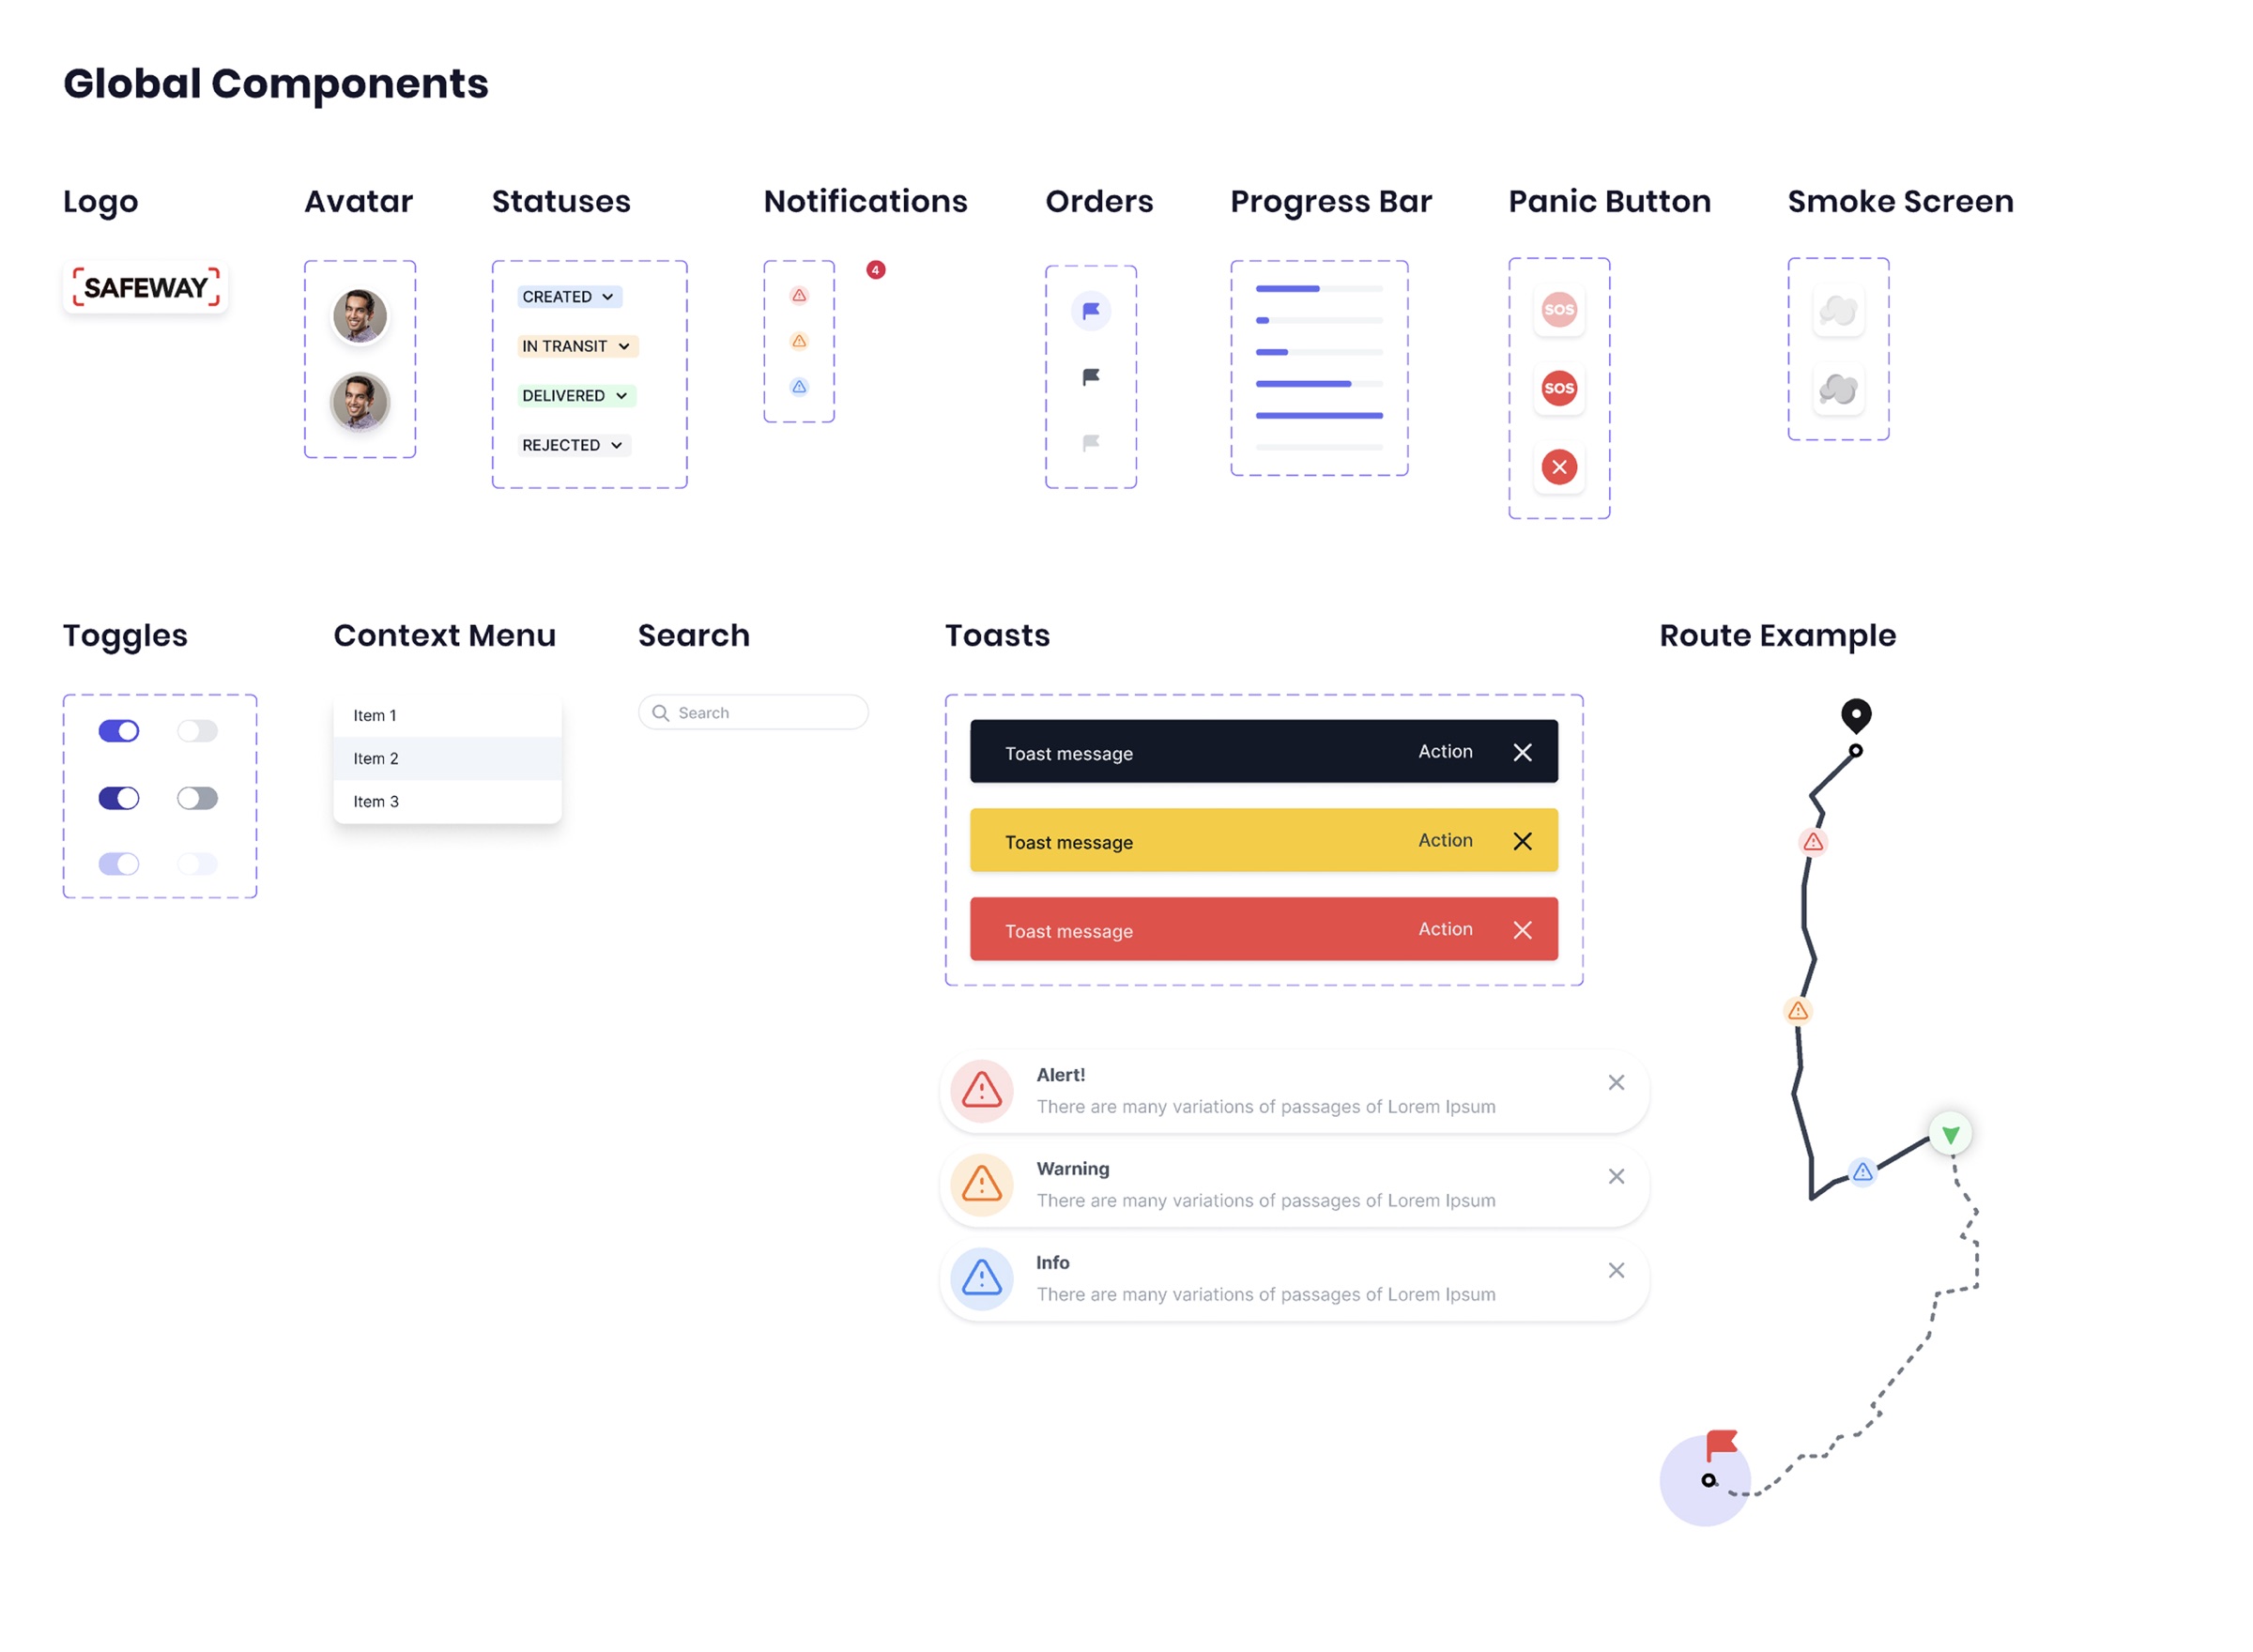
Disarming a vehicle's monitoring has real consequences — you could miss a theft. So the UX adds intentional steps: choosing a disarmament mode and setting scheduled re-armament. It's easy to arm and deliberately slower to disarm. This isn't bad UX — it's appropriate friction.
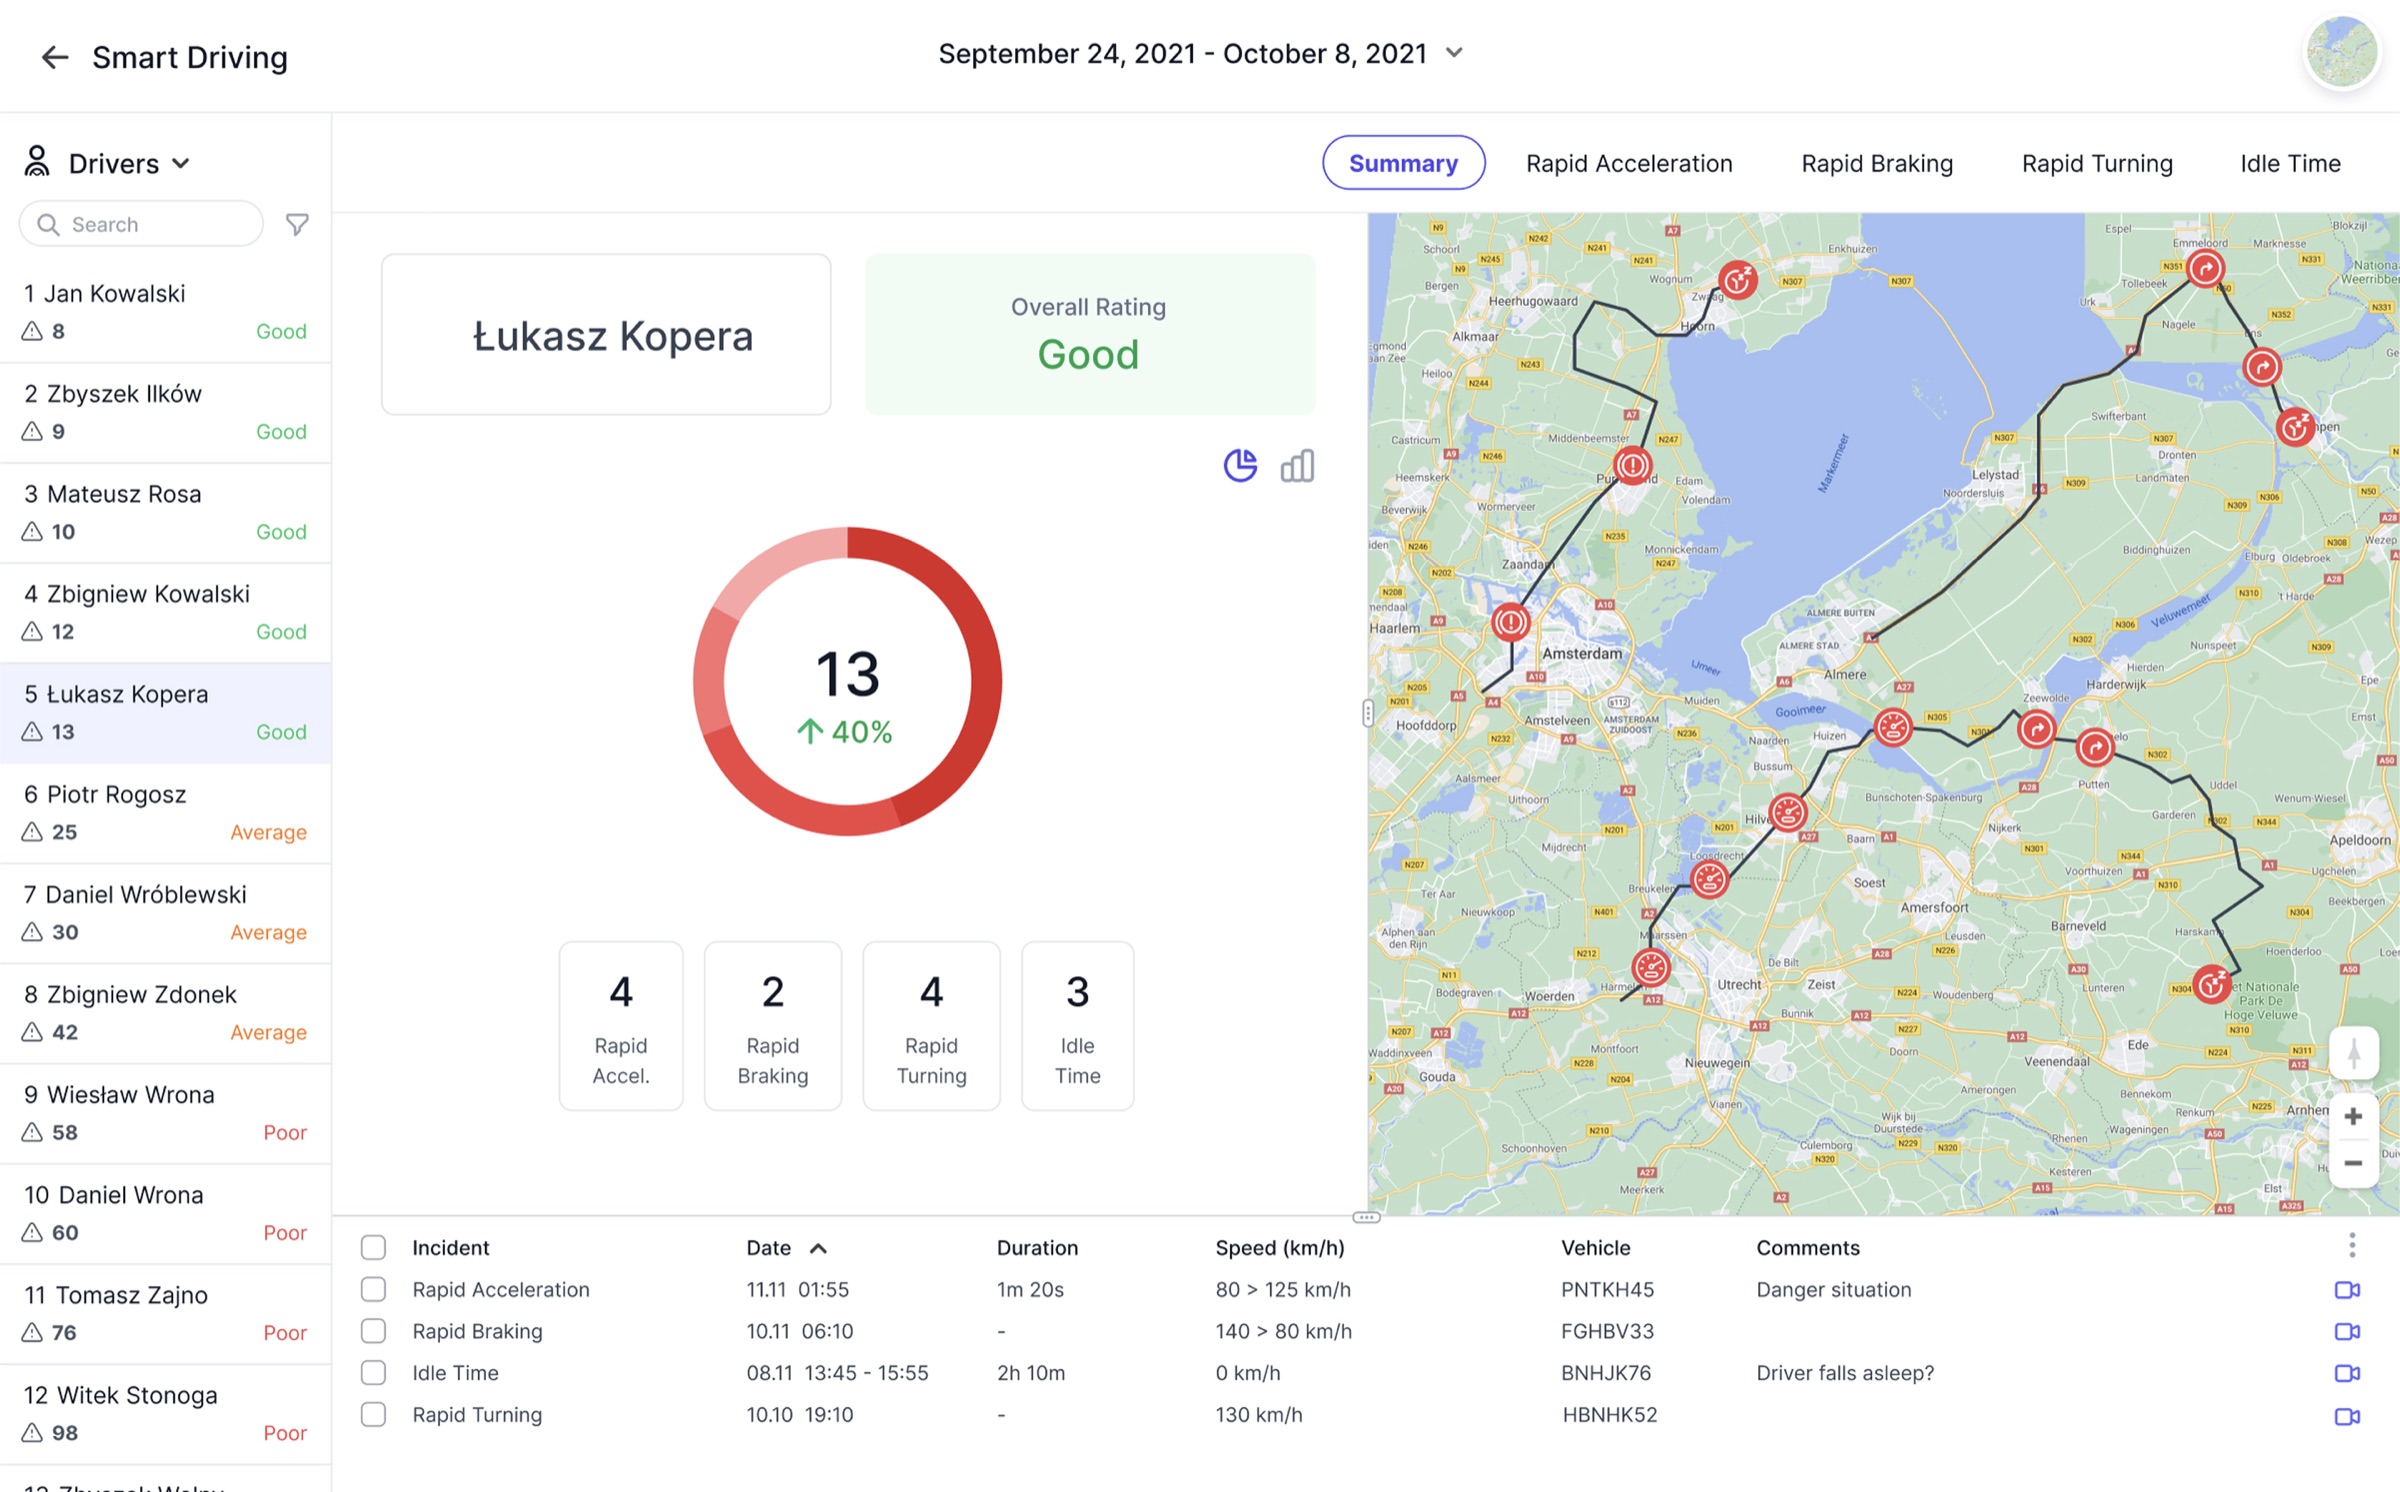
The beta pilot revealed that a score of 73 means nothing in isolation. The redesign added fleet averages and best/worst ranges. Now 73 immediately reads as "below fleet average, above the worst performers." Numbers without context aren't actionable.
A truck runs for 12 hours. Without filtering, reviewing the recording means watching 12 hours of mostly nothing. Incident-only filtering lets operators jump straight to the three moments that matter.
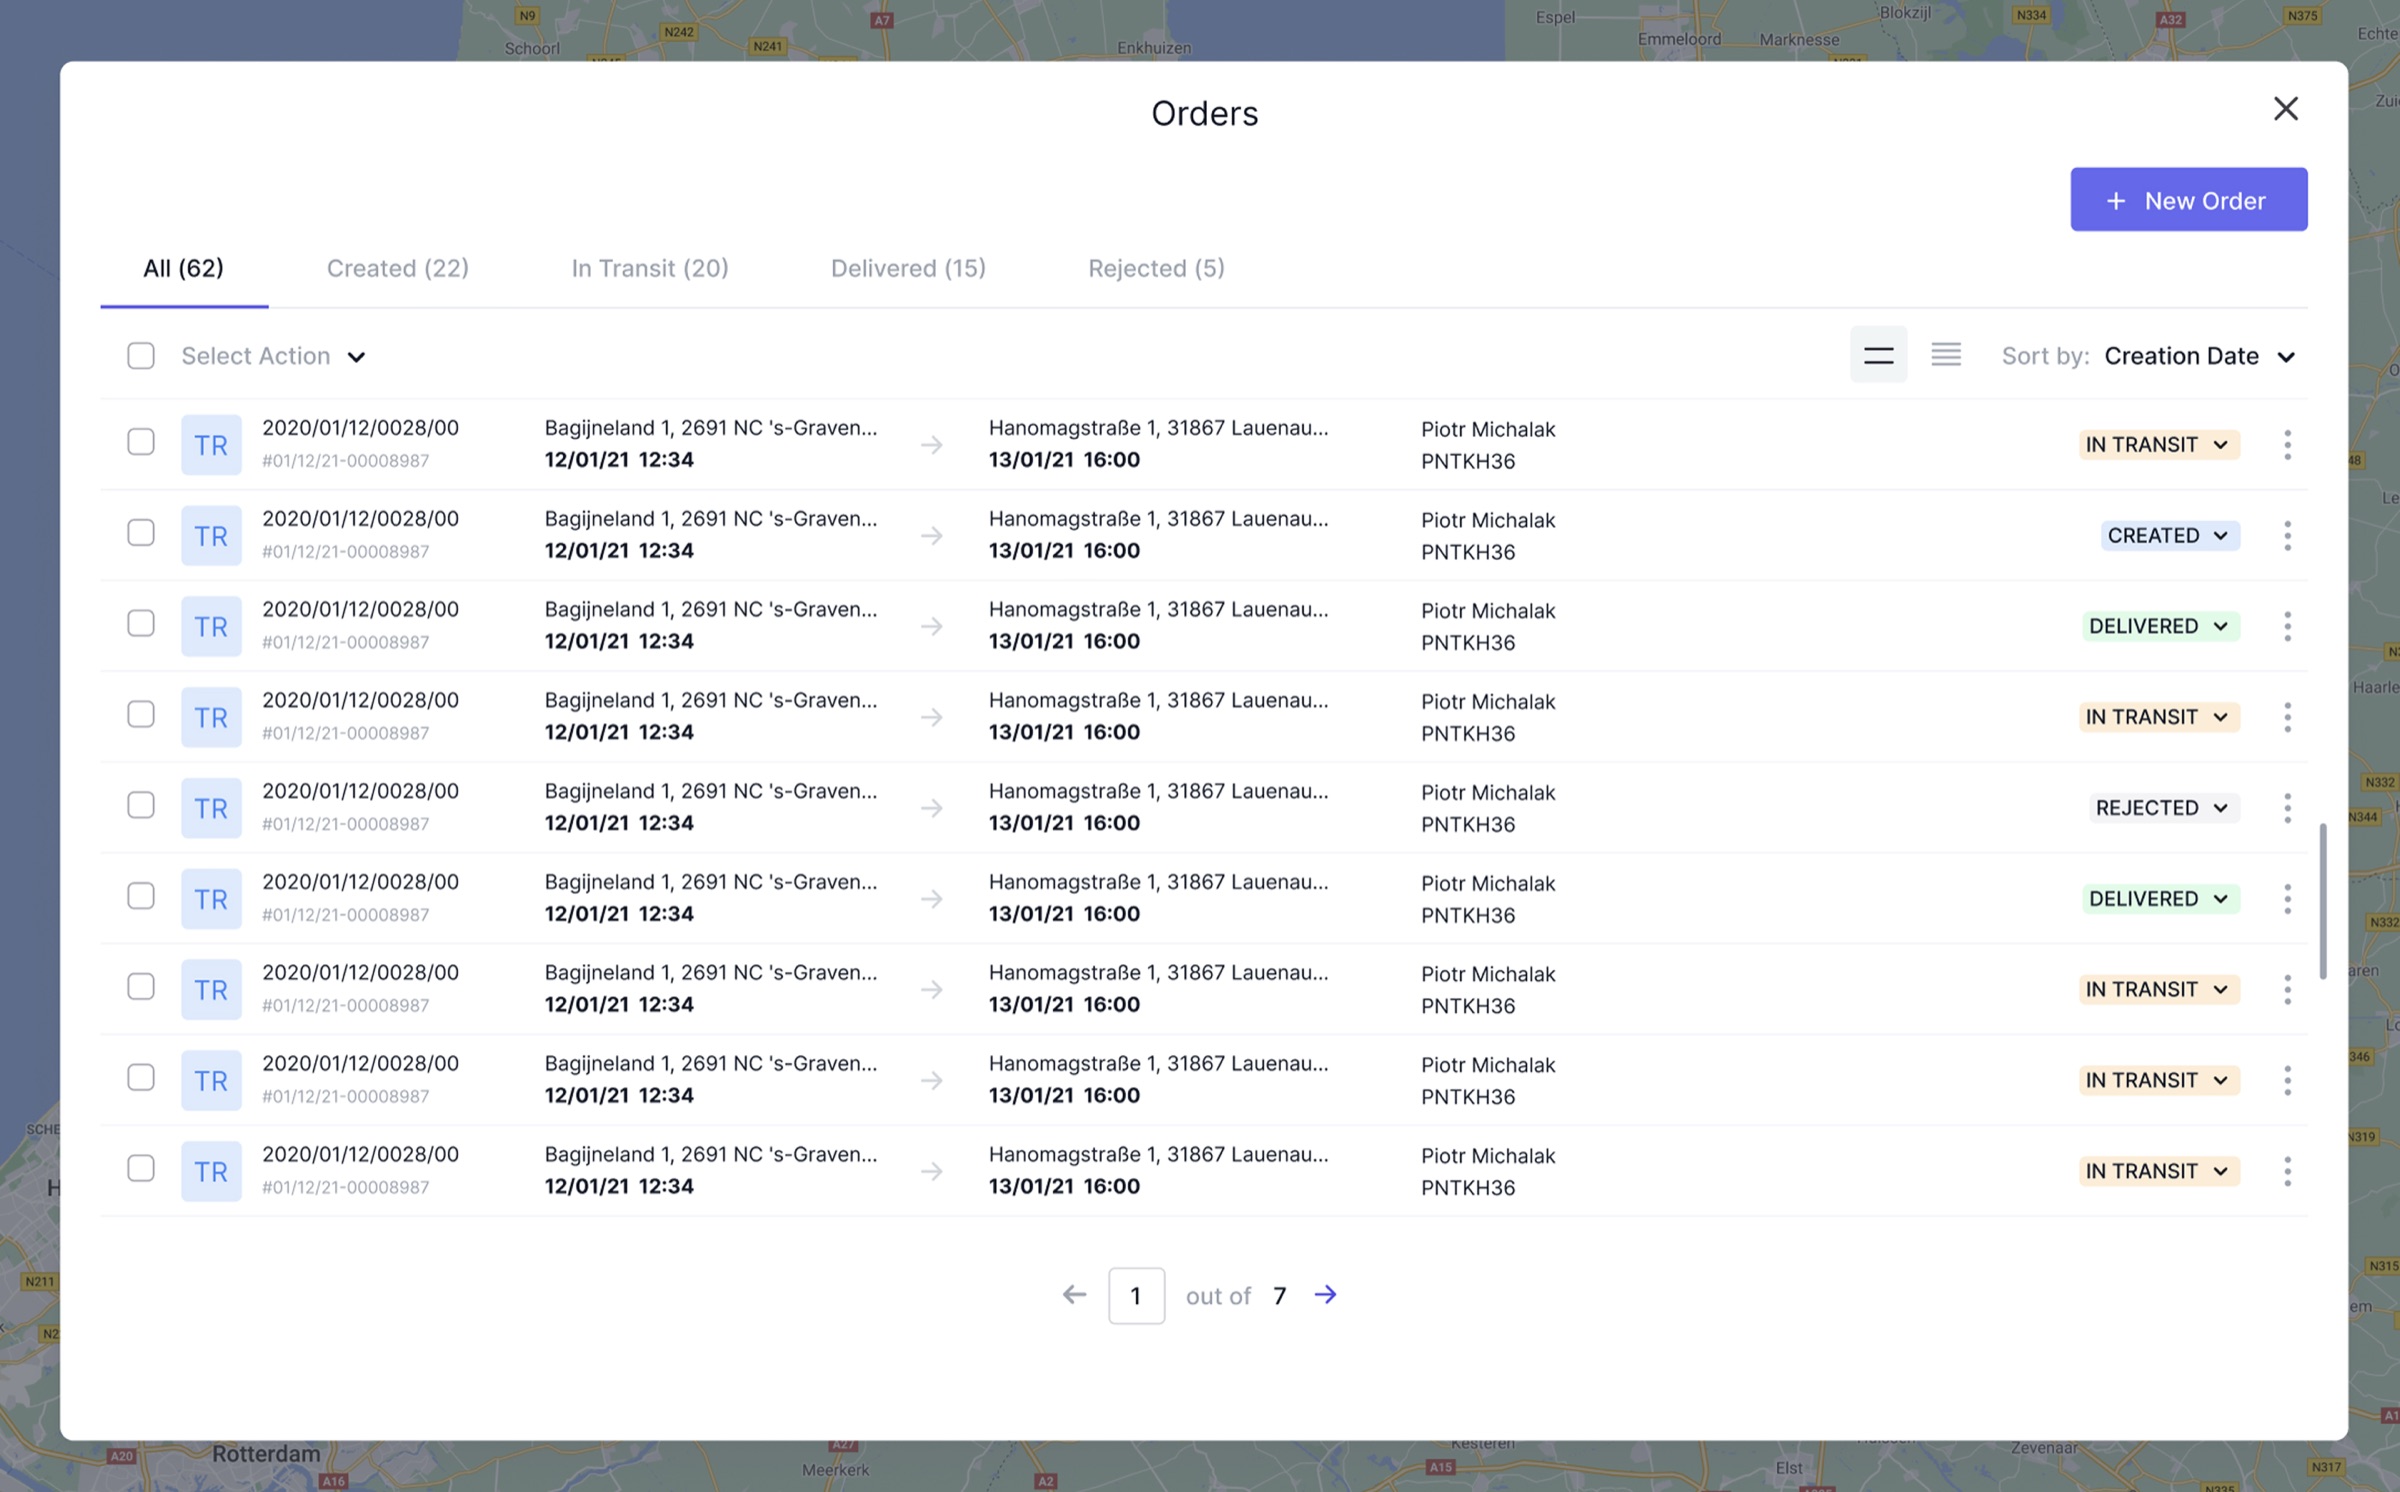
Incidents group geographically on the map as clusters that expand when clicked, revealing individual events with timestamps, engine status, and armed/disarmed state.
GPS, connectivity, battery, camera — all shown with simple green/red indicators and clear labels. In a real-time monitoring environment, you need to know instantly whether a vehicle's systems are working.
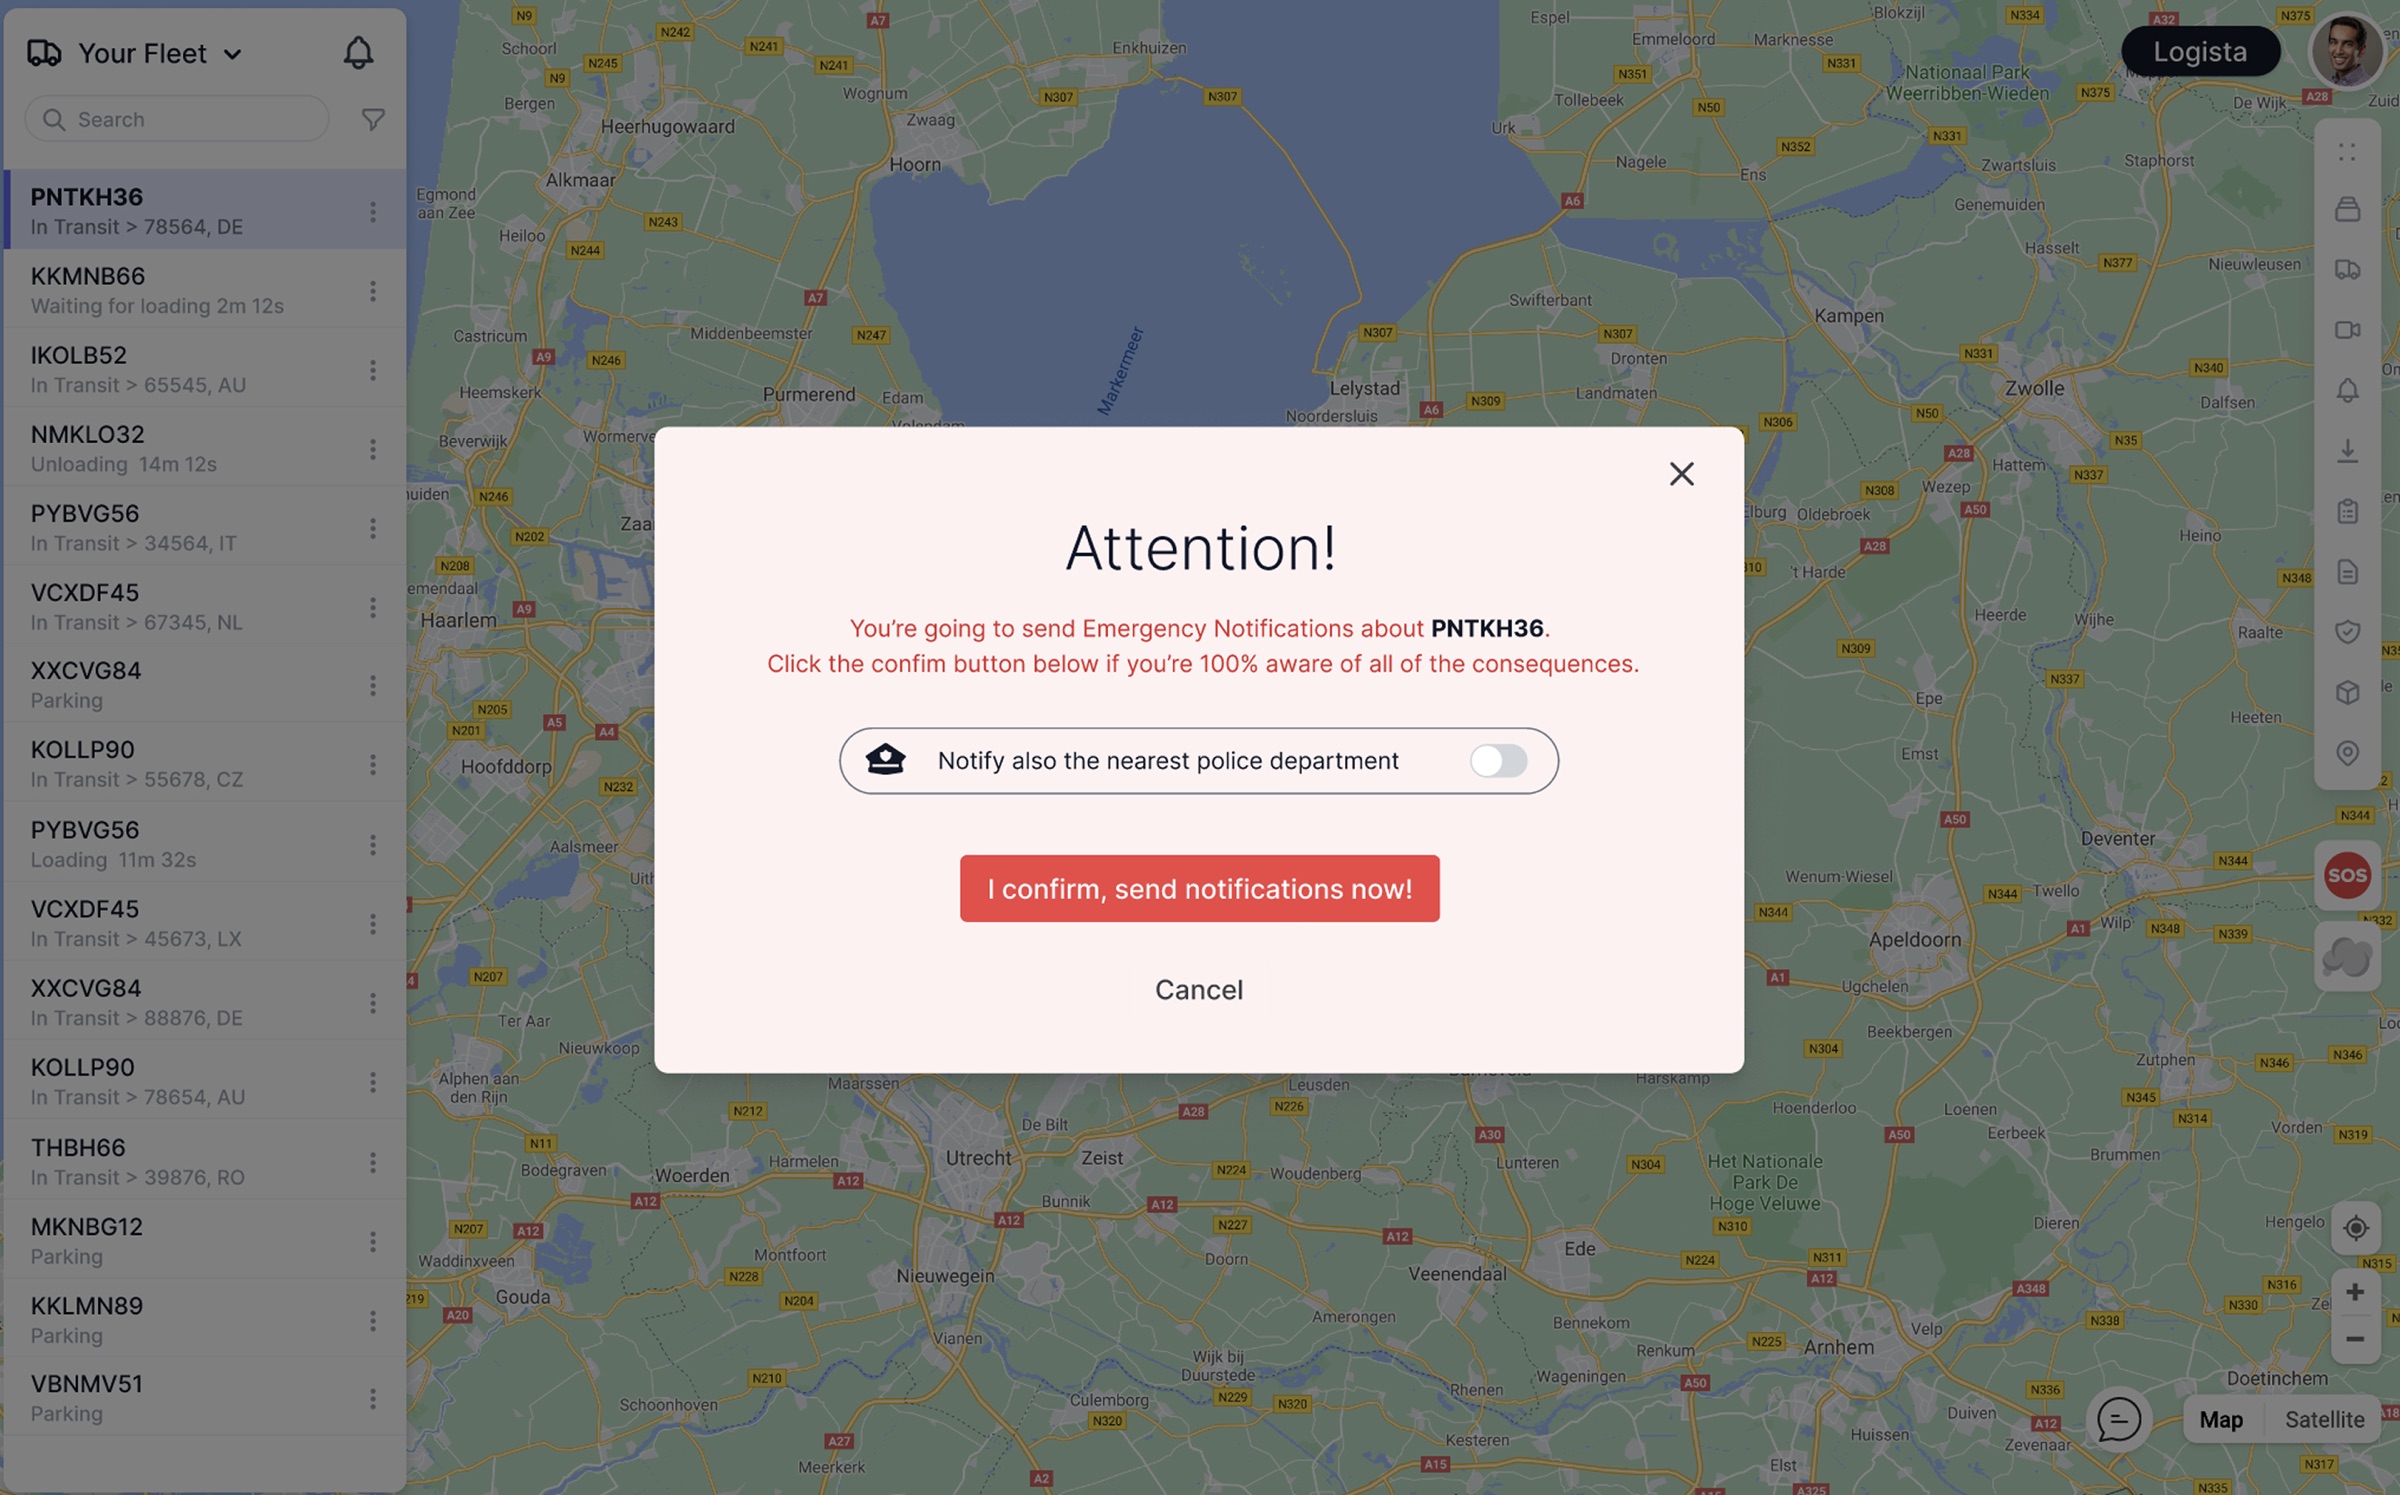
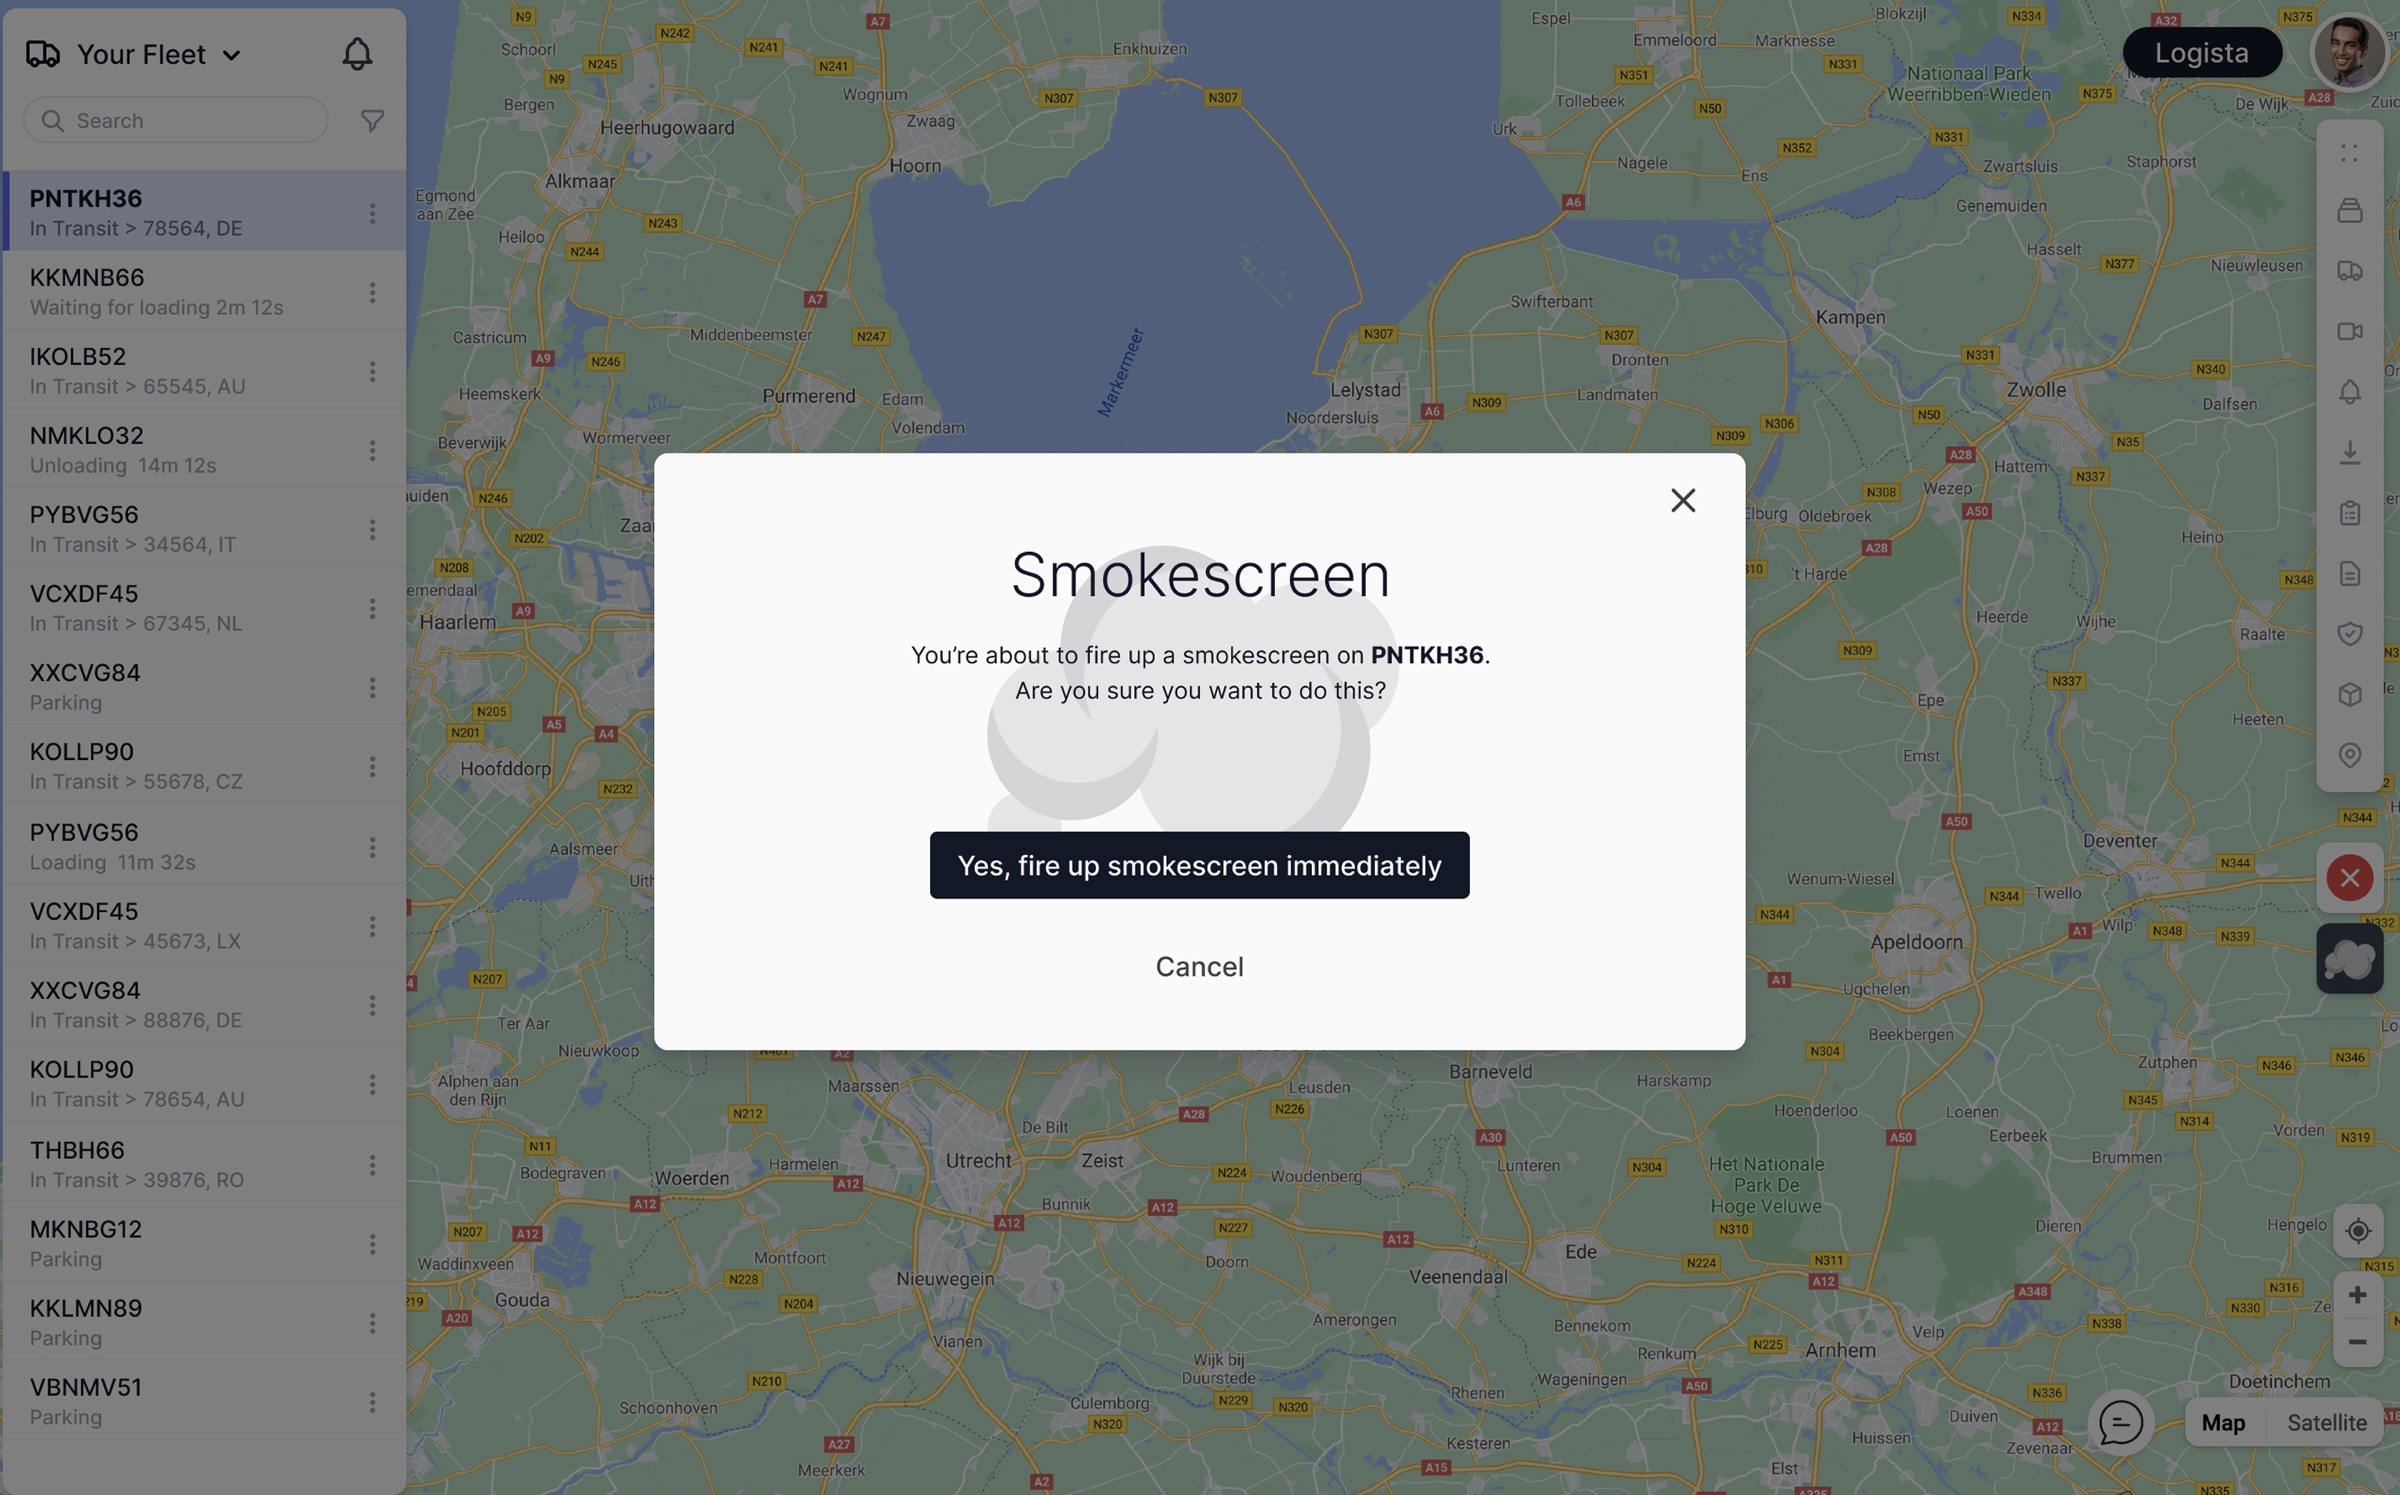
When seconds matter, the interface provides direct emergency controls. The Panic Alarm sends notifications with an option to alert the nearest police department. The Smokescreen can be triggered remotely. Both use deliberate confirmation dialogs because the consequences are irreversible.
Good design in this space isn't about aesthetics — it's about whether a €3,300 intrusion gets caught or ignored. Whether a driver's deteriorating habits get flagged before they cause an accident. Here's what the design made possible.
By replacing passive camera grids with AI-prioritized, event-driven notifications, fleet managers can actually respond to incidents in time.
The component architecture enabled Sternkraft to expand from cargo transportation into public transit (ZTM, 1,300 vehicles) without building a separate product.
Incident-only filtering and smart event clustering mean operators review dramatically less footage while catching more real problems.
The vehicle-first mental model and floating-panel workspace are intuitive enough that operators become productive in days.
The driver scoring module with contextual benchmarks gives managers data they never had before, driving behavioral change across the fleet.
In a market of engineer-built legacy tools, a well-designed modern interface becomes a selling point itself. Easier demos, faster sales cycles, lower churn.
"The biggest shift wasn't technological — it was philosophical. We stopped designing a tool that helps humans watch cameras and started designing a tool that helps humans make decisions. The AI does the watching. The interface does the thinking. The operator does the acting."